Exhibit 99.1
Letter to Our Shareholders
Fellow Shareholders,
We made meaningful progress this quarter in the scale-up of our advanced battery production facility (“Fab-1”) in Fremont, California. Importantly in September we began to manufacture battery cells from the first automated production line installed in Fab-1. Achieving this milestone was the culmination of 14 years of development work, both on our 3D battery architecture and the process technologies to manufacture it. This positions us to deliver 100% active silicon anode lithium-ion batteries with energy densities years ahead of the competition.
Meeting this key milestone will allow us to ship production-quality samples for qualification to customers by the end of Q4 2021. It also allows us to begin the process of having our cells certified by third parties for safety and abuse testing. Both are necessary steps before we can go into full production. We remain on track for first commercial production in Q1 2022 and first product revenue in Q2 2022.
We have also begun installing our second production line in Fab-1, which will initially be focused on large form factor cells for mobile electronics such as mobile communications and laptops. We expect this line to be a workhorse for qualification samples in 2022 to support our ramp with large cell mobile electronics customers in 2023. On that note, we recently began a cell design for a strategic customer in mobile communications that is intended to support multiple products.
During the quarter we also developed a new cell for augmented reality (AR) eyewear. We believe that AR has remained a nascent market partly due to the limitations of legacy battery technology. Enovix is in a unique position to remove those limitations and enable products that are both elegant and feature rich. We also shipped a unique multi-cell pack design in the quarter that features wearable-class Enovix batteries designed for a key strategic customer.
We are experiencing robust demand from our customers who are eager to leverage our battery cells to bring new features, form factors and functionalities to market, in some cases for multiple follow-on projects. Some of our customers have thus begun audits of Fab-1 as part of their qualification process in preparation for volume production next year.
Last, we announced today the appointment of Pegah Ebrahimi to our Board of Directors. Ebrahimi is a seasoned technology leader having served as Chief Operating Officer of the Collaboration Technology Group at Cisco Systems Inc. and Chief Operating Officer of Morgan Stanley’s Global Technology Banking franchise. Her broad experience helping technology companies scale will be extremely valuable as we enter the next phase of our growth.
1
Scorecard
As we evolve from a company focused predominantly on R&D to a company capable of volume production and commercialization, we believe shareholders should evaluate our progress across five key areas, as detailed in our first Shareholder Letter in August:
Category |
Milestone |
1. Technology and Products |
EX-1: 900 Wh/L energy density 2022 EX-2: 1,030 Wh/L energy density 2023 EX-3: 1,255 Wh/L energy density 2025 |
2. Manufacturing and Scale-Up |
Fab-1: First revenue Q2 2022 Fab-2: First revenue Q2 2023 |
3. Commercialization |
Progress funnel to revenue |
4. Market Expansion |
Broaden end market applications |
5. Financials |
$1 billion+ annualized revenue by Q425 with 50% GM and 30% EBIT |
Technology and Products. We have already started development of our next-generation manufacturing equipment based on learning from our first lines and added talent in the areas of high-speed automation, machine design and process development.
Enovix is expanding its global footprint by establishing an R&D center in India that will initially focus on developing machine learning algorithms to improve predictive modeling of battery performance and accelerate our rate of learning. We believe this will allow us to add top talent in machine learning, electrochemistry, and test algorithms.
Manufacturing and Scale-Up. Fab-1 was fully equipped during the quarter, and by September we were able to produce the first batteries from our first automated production line. The line is now moving into a qualification stage in which our equipment engineering, process engineering and quality teams are driving enhancements throughout the line to prepare us for initial volume production next year. By the end of Q4 2021 we expect to send our first production samples to several customers for final manufacturing line qualification. As a reminder, these customers have already received near-final versions of their batteries from our pilot line which met their specifications through a technology qualification process.
We also began installing our second production line in Fremont. Our second line is important in that it will produce production qualification samples for customers in the mobile communications and computing end markets, which are key to our growth in 2023 and beyond as we scale up Fab-2.
Regarding Fab-2, we continued our due diligence and are in active negotiations on several attractive options. As a reminder, our goal is for Fab-2 to produce first revenue in mid-2023 which means we plan on ordering equipment by early next year.
2
Commercialization. Our commercialization efforts in the quarter focused on sampling and qualifying our customers.
We launched a marketing campaign “Just in Time for the Future” to highlight the role our batteries can play in enabling new products and industries. The results of the campaign have been encouraging with increases in engagement and viewership across all our multimedia channels (Enovix.com, social, video). We will continue to invest in the Enovix brand with the goal of building awareness and trust among our key constituents
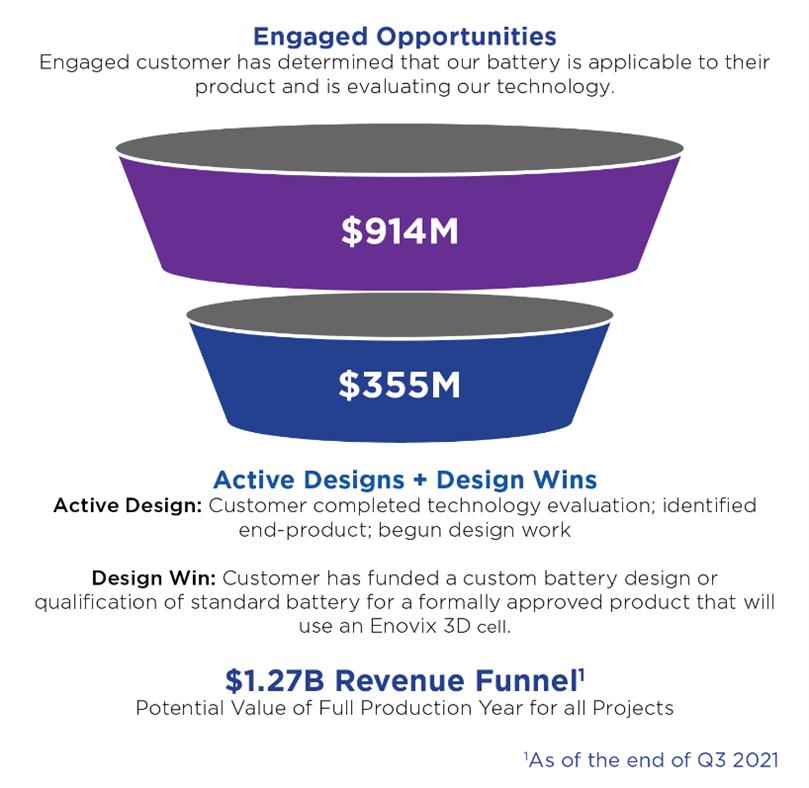
Our total revenue funnel at the end of the quarter was $1.27 billion, including $914 million of engaged opportunities and $355 million of active designs and design wins.
Market Expansion. During the quarter we developed a new battery for the AR market. This small, lightweight battery (<5 grams; <3.5mm thick) is key to enabling compute intensive eyewear in an elegant form factor that our customers tell us is necessary for mass adoption.
We continued to make progress on our electric vehicle program, evaluating the use of EV battery materials within our architecture as part of our three-year grant from the U.S. Department of Energy. We are seeing interest in our technology from EV OEMs and intend to accelerate our efforts by adding technical and business development resources to address this market.
Finally, we shipped sample batteries for preliminary testing as part of our demonstration contract with the U.S. Army. We have received great feedback from our partners in this market given our potential to provide a domestic source of supply along with improved energy density and safety.
Financials. We remain on track to deliver our first product revenue in Q2 2022 and scale up in the years thereafter. We continue to target exiting 2025 with over $1 billion of annualized revenue.
3
Company Strategy
Our progress in the third quarter moved us closer to delivering batteries with record energy densities for industry-leading customers in mobile electronics in 2022.
We are targeting this market initially for several reasons:
Our near-term focus is on the following market applications: wearables (smartwatches, AR/VR, headsets, etc.), computing and mobile communications. We estimate the total addressable market for Lithium-ion batteries in these markets to be $13 billion in 2025. We are actively sampling to potential customers across all three of these markets and have design wins in each. We believe this strategy will allow Enovix to deliver energy densities years ahead of the competition and provide a meaningful head start to reach scale and benefit from manufacturing learning curves.
In wearables, we see OEMs struggling to add new features for always-on health monitoring due to energy constraints from current generation batteries. Adding features is important for OEMs to drive upgrade cycles and maintain their competitive position. Some OEMs are also leveraging data feeds from wearable products to deliver actionable data for which an end user will pay a service fee. Time spent on the battery charger is time lost collecting usable data for these services. We also see some wearable OEMs that would like to add 5G radios to their devices but are challenged to do so given power consumption. There is a need for a better battery and as a result we have strong engagements with multiple wearable brands.
Within the wearable category, we are also continuing to make progress with customers pursuing our batteries for Augmented Reality (AR) devices. Notably, we are beginning to see eyewear products released onto the market with a limited feature set (photo capture, streaming music). These are good proof points for the category but also highlight the need for increased energy density to support the greater functionality and longer run time needed for true mass adoption.
In computing, competitive differentiation is increasingly coming down to how closely the laptop experience mirrors that of a smartphone in terms of always-on all-day functionality. There are multiple technologies that have a role to play in achieving that goal with the battery being critical. We are working closely with multiple leading laptop OEMs and are positioning ourselves to serve this market with added production capacity via our planned Fab-2 facility for the larger cells this will require.
In mobile communications, we have engagements across several product categories, all of which are starved for increased energy density in their batteries. In smartphones, modern batteries limit the usage of power-hungry 5G radios and on-device artificial intelligence (AI) processors. In enterprise class devices, we have multiple engagements because these devices endure heavy usage and thus are severely limited in features and functionality unless a higher energy density battery is utilized.
We believe our focus on these initial categories will prepare us to address the EV battery opportunity by 2025. Entering the EV market requires billions of dollars of capital to build Gigafactories, lower costs than conventional cells and long qualification cycles. We believe the best approach for our shareholders is to start
4
in lower volume premium markets where we can prove out our technology and manufacturing process while driving toward profitability. At the same time, we are seeding our entry into the EV market by sampling batteries to EV OEMs and continuing work on our three-year grant with the U.S. Department of Energy to develop batteries featuring our silicon anode paired with EV-class cathode materials.
Outlook
Enovix expects to make meaningful progress toward our goal of starting commercial production in Q1 2022 with product revenue in Q2 2022. We are well-capitalized and remain on track to fund our plan.
For full-year 2021 we continue to expect to use between $110 million and $120 million of free cash flow to continue our Fab-1 buildout and make critical hires.
Summary
We are focused on volume production of our advanced silicon anode lithium-ion batteries in 2022. Building the first cells on our automated production line in the third quarter was a watershed moment for Enovix. To achieve this milestone, we had to develop multiple generations of manufacturing process technologies and implement rigorous qualification and quality processes.
Our focus in the fourth quarter is on completing our Fab-1 qualification and delivering production quality cells that meet customer specifications and industry certifications.
When we begin volume production, we believe Enovix will have ushered in the most significant battery architecture innovation in 30 years, enabling both the next generation of mobile electronics devices and a path for widespread adoption of electric vehicles.
Quarterly Conference Call and Webcast
Monday, November 8 / 2 p.m. PT / 5 p.m. ET
Webcast: ir.enovix.com
Dial-in: (833) 865-1567, passcode: 8849069
5
Enovix Corporation
Condensed Consolidated Balance Sheets (Unaudited)
(In Thousands, Except Share and per Share Amounts)
|
|
October 3, |
|
|
December 31, |
|
||
|
|
2021 |
|
|
2020 |
|
||
Assets |
|
|
|
|
|
|
||
Current assets: |
|
|
|
|
|
|
||
Cash and cash equivalents |
|
$ |
338,746 |
|
|
$ |
29,143 |
|
Deferred contract costs |
|
|
4,371 |
|
|
|
2,955 |
|
Prepaid expenses and other current assets |
|
|
3,771 |
|
|
|
946 |
|
Total current assets |
|
|
346,888 |
|
|
|
33,044 |
|
Property and equipment, net |
|
|
61,596 |
|
|
|
31,290 |
|
Operating lease, right-of-use assets |
|
|
6,796 |
|
|
|
— |
|
Deferred contract costs, non-current |
|
— |
|
|
|
495 |
|
|
Other assets, non-current |
|
|
141 |
|
|
|
135 |
|
Total assets |
|
$ |
415,421 |
|
|
$ |
64,964 |
|
Liabilities, Convertible Preferred Stock and Stockholders’ Equity |
|
|
|
|
|
|
||
Current liabilities: |
|
|
|
|
|
|
||
Accounts payable |
|
$ |
1,713 |
|
|
$ |
2,083 |
|
Accrued expenses |
|
|
4,520 |
|
|
|
1,999 |
|
Accrued compensation |
|
|
3,107 |
|
|
|
1,268 |
|
Deferred revenue |
|
|
5,495 |
|
|
|
5,410 |
|
Other liabilities |
|
|
660 |
|
|
|
108 |
|
Total current liabilities |
|
|
15,495 |
|
|
|
10,868 |
|
Deferred rent, non-current |
|
— |
|
|
|
1,567 |
|
|
Warrant liability, at fair value |
|
|
64,440 |
|
|
|
15,995 |
|
Operating lease liabilities, non-current |
|
|
9,263 |
|
|
— |
|
|
Deferred revenue, non-current |
|
|
2,290 |
|
|
|
85 |
|
Other liabilities, non-current |
|
|
227 |
|
|
|
233 |
|
Total liabilities |
|
|
91,715 |
|
|
|
28,748 |
|
Commitments and Contingencies |
|
|
|
|
|
|
||
Stockholders’ equity: |
|
|
|
|
|
|
||
Common stock, $0.0001 par value; authorized shares of 1,000,000,000; issued and outstanding shares of 145,185,904 and 100,016,559 as of October 3, 2021 and December 31, 2020, respectively |
|
|
14 |
|
|
|
10 |
|
Preferred stock, $0.0001 par value; authorized shares of 10,000,000 and 0 as of October 3, 2021 and December 31, 2020; none issued and outstanding shares as of October 3, 2021 and December 31, 2020, respectively |
|
|
— |
|
|
|
— |
|
Additional paid-in-capital |
|
|
572,276 |
|
|
|
243,484 |
|
Accumulated deficit |
|
|
(248,584 |
) |
|
|
(207,278 |
) |
Total stockholders’ equity |
|
|
323,706 |
|
|
|
36,216 |
|
Total liabilities, convertible preferred stock and stockholders’ equity |
|
$ |
415,421 |
|
|
$ |
64,964 |
|
6
Enovix Corporation
Condensed Consolidated Statements of Operations (Unaudited)
(In Thousands, Except Share and per Share Amounts)
|
|
Quarter Ended October 3, 2021 |
|
|
Three Months Ended |
|
|
39-Week Period Ended October 3, 2021 |
|
|
Nine Months Ended September 30, 2020 |
|
||||
Operating expenses: |
|
|
|
|
|
|
|
|
|
|
|
|
||||
Cost of revenue |
|
$ |
104 |
|
|
$ |
1,153 |
|
|
$ |
1,847 |
|
|
$ |
2,382 |
|
Research and development |
|
|
10,301 |
|
|
|
3,807 |
|
|
|
25,413 |
|
|
|
9,442 |
|
Selling, general and administrative |
|
|
8,791 |
|
|
|
1,486 |
|
|
|
17,500 |
|
|
|
3,766 |
|
Total operating expenses |
|
|
19,196 |
|
|
|
6,446 |
|
|
|
44,760 |
|
|
|
15,590 |
|
Loss from operations |
|
|
(19,196 |
) |
|
|
(6,446 |
) |
|
|
(44,760 |
) |
|
|
(15,590 |
) |
Other income (expense): |
|
|
|
|
|
|
|
|
|
|
|
|
||||
Change in fair value of convertible preferred stock warrants and common stock warrants |
|
|
8,460 |
|
|
|
(7,031 |
) |
|
|
3,679 |
|
|
|
(6,756 |
) |
Issuance of convertible preferred stock warrants |
|
|
— |
|
|
|
— |
|
|
|
— |
|
|
|
(1,476 |
) |
Change in fair value of convertible promissory notes |
|
|
— |
|
|
|
— |
|
|
|
— |
|
|
|
(2,422 |
) |
Interest expense, net |
|
|
(52 |
) |
|
|
— |
|
|
|
(187 |
) |
|
|
(107 |
) |
Other (expense) income, net |
|
|
(50 |
) |
|
|
1 |
|
|
|
(38 |
) |
|
|
43 |
|
Total other income (expense), net |
|
|
8,358 |
|
|
|
(7,030 |
) |
|
|
3,454 |
|
|
|
(10,718 |
) |
Net loss |
|
$ |
(10,838 |
) |
|
$ |
(13,476 |
) |
|
$ |
(41,306 |
) |
|
$ |
(26,308 |
) |
|
|
|
|
|
|
|
|
|
|
|
|
|
||||
Net loss per share, basic and diluted |
|
$ |
(0.08 |
) |
|
$ |
(0.16 |
) |
|
$ |
(0.38 |
) |
|
$ |
(0.35 |
) |
Weighted average number of common shares outstanding, basic and diluted |
|
|
133,492,216 |
|
|
|
85,637,835 |
|
|
|
109,317,614 |
|
|
|
76,167,628 |
|
7
Enovix Corporation
Condensed Consolidated Statements of Cash Flows (Unaudited)
(In Thousands)
|
|
39-Week Period Ended |
|
|
Nine Months Ended |
|
||
Cash flows from operating activities: |
|
|
|
|
|
|
||
Net loss |
|
$ |
(41,306 |
) |
|
$ |
(26,308 |
) |
Adjustments to reconcile net loss to net cash used in operating activities |
|
|
|
|
|
|
||
Depreciation |
|
|
674 |
|
|
|
436 |
|
Amortization of right-of-use assets |
|
|
388 |
|
|
|
— |
|
Stock-based compensation expense |
|
|
6,717 |
|
|
|
197 |
|
Changes in fair value of convertible preferred stock warrants and common stock warrants |
|
|
(3,679 |
) |
|
|
6,756 |
|
Issuance of convertible preferred stock warrants (non-cash) |
|
|
— |
|
|
|
1,476 |
|
Change in fair value of convertible promissory notes |
|
|
— |
|
|
|
2,422 |
|
Loss on early debt extinguishment |
|
|
60 |
|
|
|
— |
|
Interest expense (non-cash) |
|
|
— |
|
|
|
107 |
|
Changes in operating assets and liabilities: |
|
|
|
|
|
|
||
Prepaid expenses and other assets |
|
|
(1,645 |
) |
|
|
116 |
|
Deferred contract costs |
|
|
(1,279 |
) |
|
|
(1,947 |
) |
Accounts payable |
|
|
(357 |
) |
|
|
(122 |
) |
Accrued expenses and compensation |
|
|
3,173 |
|
|
|
526 |
|
Deferred revenue |
|
|
2,290 |
|
|
|
185 |
|
Deferred rent |
|
|
— |
|
|
|
686 |
|
Other liabilities |
|
|
450 |
|
|
|
(61 |
) |
Net cash used in operating activities |
|
|
(34,514 |
) |
|
|
(15,531 |
) |
Cash flows from investing activities: |
|
|
|
|
|
|
||
Purchase of property and equipment |
|
|
(31,509 |
) |
|
|
(18,923 |
) |
Net cash used in investing activities |
|
|
(31,509 |
) |
|
|
(18,923 |
) |
Cash flows from financing activities: |
|
|
|
|
|
|
||
Proceeds from Business Combination and PIPE financing |
|
|
405,155 |
|
|
|
— |
|
Payments of transaction costs related to Business Combination and PIPE financing |
|
|
(29,641 |
) |
|
|
— |
|
Proceeds from issuance of convertible preferred stock, net |
|
|
— |
|
|
|
58,275 |
|
Proceeds from secured promissory notes, converted promissory notes and paycheck protection program loan |
|
|
15,000 |
|
|
|
1,628 |
|
Repayment of secured promissory note |
|
|
(15,000 |
) |
|
|
— |
|
Payment of debt issuance costs |
|
|
(90 |
) |
|
|
— |
|
Proceeds from exercise of convertible preferred stock warrants |
|
|
102 |
|
|
|
— |
|
Proceeds from the exercise of stock options |
|
|
163 |
|
|
|
7 |
|
Repurchase of unvested restricted common stock |
|
|
(13 |
) |
|
|
— |
|
Net cash provided by financing activities |
|
|
375,676 |
|
|
|
59,910 |
|
Change in cash, cash equivalents, and restricted cash |
|
|
309,653 |
|
|
|
25,456 |
|
Cash and cash equivalents and restricted cash, beginning of period |
|
|
29,218 |
|
|
|
10,301 |
|
Cash and cash equivalents, and restricted cash, end of period |
|
$ |
338,871 |
|
|
$ |
35,757 |
|
|
|
|
|
|
|
|
||
Supplemental cash flow data (Non-cash): |
|
|
|
|
|
|
||
Conversion of preferred stock to common stock |
|
$ |
222,933 |
|
|
$ |
— |
|
Net liabilities assumed from Business Combination |
|
|
73,400 |
|
|
|
— |
|
Accrued purchase of property and equipment |
|
|
2,606 |
|
|
|
1,411 |
|
Accrued purchase of transaction costs |
|
|
1,370 |
|
|
|
— |
|
Conversion of promissory notes to convertible preferred stock |
|
|
— |
|
|
|
8,073 |
|
Settlement of accrued interest expense through conversion of promissory notes to convertible preferred stock |
|
|
— |
|
|
|
130 |
|
Issuance of convertible preferred stock warrants |
|
|
— |
|
|
|
1,476 |
|
8
Net Loss to Adjusted EBITDA
While we prepare our condensed consolidated financial statements in accordance with GAAP, we also utilize and present certain financial measures that are not based on GAAP. We refer to these financial measures as “Non-GAAP” financial measures. In addition to our financial results determined in accordance with GAAP, we believe that EBITDA and Adjusted EBITDA are useful measures in evaluating its financial and operational performance distinct and apart from financing costs, certain non-cash expenses and non-operational expenses.
These Non-GAAP financial measures should be considered in addition to results prepared in accordance with GAAP but should not be considered a substitute for or superior to GAAP. We endeavor to compensate for the limitation of the Non-GAAP financial measures presented by also providing the most directly comparable GAAP measures.
We use Non-GAAP financial information to evaluate our ongoing operations and for internal planning, budgeting and forecasting purposes. We believe that Non-GAAP financial information, when taken collectively, may be helpful to investors in assessing its operating performance and comparing its performance with competitors and other comparable companies. You should review the reconciliations below but not rely on any single financial measure to evaluate our business.
“EBITDA” is defined as earnings (net loss) adjusted for interest expense; income taxes; depreciation expense, and amortization expense. “Adjusted EBITDA” includes additional adjustments to EBITDA such as stock-based compensation expense; change in fair value of convertible preferred stock warrants, common stock warrants and convertible promissory notes; and other special items as determined by management which it does not believe to be indicative of its underlying business trends.
Below is a reconciliation of net loss on a GAAP basis to the Non-GAAP EBITDA and Adjusted EBITDA financial measures for the periods presented below (in thousands):
|
|
Quarter Ended |
|
|
Three Months Ended |
|
|
|
39-Week Period Ended |
|
|
Nine Months Ended |
|
||||
Net loss |
|
$ |
(10,838 |
) |
|
$ |
(13,476 |
) |
|
|
$ |
(41,306 |
) |
|
$ |
(26,308 |
) |
Interest expense, net |
|
|
52 |
|
|
|
— |
|
|
|
|
187 |
|
|
|
107 |
|
Depreciation and amortization |
|
|
687 |
|
|
|
147 |
|
|
|
|
1,062 |
|
|
|
436 |
|
EBITDA |
|
|
(10,099 |
) |
|
|
(13,329 |
) |
|
|
|
(40,057 |
) |
|
|
(25,765 |
) |
Stock-based compensation |
|
|
3,042 |
|
|
|
81 |
|
|
|
|
6,717 |
|
|
|
197 |
|
Change in fair value of convertible preferred stock warrants and common stock warrants |
|
|
(8,460 |
) |
|
|
7,031 |
|
|
|
|
(3,679 |
) |
|
|
6,756 |
|
Issuance of convertible preferred stock warrants |
|
|
— |
|
|
|
— |
|
|
|
|
— |
|
|
|
1,476 |
|
Change in fair value of convertible promissory notes |
|
|
— |
|
|
|
— |
|
|
|
|
— |
|
|
|
2,422 |
|
Loss on early debt extinguishment |
|
|
60 |
|
|
|
— |
|
|
|
|
60 |
|
|
|
— |
|
Adjusted EBITDA |
|
$ |
(15,457 |
) |
|
$ |
(6,217 |
) |
|
|
$ |
(36,959 |
) |
|
$ |
(14,914 |
) |
9
Free Cash Flow
Below is a reconciliation of Net cash used in operating activities to the Free Cash Flow financial measures for the periods presented below (in thousands):
|
|
39-Week Period Ended October 3, 2021 |
|
|
Nine Months Ended September 30, 2020 |
|
||
Net cash used in operating activities |
|
$ |
(34,514 |
) |
|
$ |
(15,531 |
) |
Capital (expenditures) |
|
|
(31,509 |
) |
|
|
(18,923 |
) |
Free Cash Flow (1) |
|
$ |
(66,023 |
) |
|
$ |
(34,454 |
) |
(1) |
We define “Free Cash Flow” as (i) Net cash from operating activities less (ii) capital expenditures, net of proceeds from disposals of property and equipment, all of which are derived from our condensed consolidated statements of cash flow. The presentation of non-GAAP Free Cash Flow is not intended as an alternative measure of cash flows from operations, as determined in accordance with GAAP. We believe that this financial measure is useful to investors because it provides investors to view our performance using the same tool that we use to gauge our progress in achieving our goals and it is an indication of cash flow that may be available to fund investments in future growth initiatives. |
Management’s Use of Non-GAAP Financial Measures
EBITDA, Adjusted EBITDA and Free Cash Flow are intended as supplemental financial measures of our performance that are neither required by, nor presented in accordance with GAAP. We believe that the use of EBITDA, Adjusted EBITDA and Free Cash Flow provides an additional tool for investors to use in evaluating ongoing operating results, trends, and in comparing our financial measures with those of comparable companies, which may present similar Non-GAAP financial measures to investors.
However, you should be aware that when evaluating EBITDA, Adjusted EBITDA, and Free Cash Flow, we may incur future expenses similar to those excluded when calculating these measures. In addition, the presentation of these measures should not be construed as an inference that our future results will be unaffected by unusual or nonrecurring items. Our computation of EBITDA, Adjusted EBITDA, and Free Cash Flow may not be comparable to other similarly titled measures computed by other companies, because all companies may not calculate EBITDA, Adjusted EBITDA and Free Cash Flow in the same fashion.
Forward-Looking Statements
This letter to shareholders contains forward-looking statements within the meaning of Section 27A of the Securities Act of 1933, as amended, and Section 21E of the Securities Exchange Act of 1934, as amended, about us and our industry that involve substantial risks and uncertainties. Forward-looking statements generally relate to future events or our future financial or operating performance. In some cases, you can identify forward-looking statements because they contain words such as “believe”, “will”, “may”, “estimate”, “continue”, “anticipate”, “intend”, “should”, “plan”, “expect”, “predict”, “could”, “potentially", “target”, “project”, “believe”, “continue” or the negative of these terms or similar expressions. Forward-looking statements in this letter to shareholders include, but are not limited to, statements regarding our financial and business performance, our ability to build and scale our advanced silicon-anode lithium-ion battery, our production and commercialization timeline, our ability to meet milestones and deliver on our objectives and expectations, the implementation and success of our business model and growth strategy, various addressable markets, market opportunity and the expansion of our customer base, our ability to meet the expectations of new and current customers, our ability to achieve market acceptance for our products, our ability to attract and hire additional service providers, the strength of our brand, the build out of additional production lines, our future product development and roadmap and the future demand for our lithium ion battery solutions. Actual results could differ materially from these forward-looking statements as a result of certain risks and uncertainties, including, without limitation, the risks set forth under the caption “Risk
10
Factors” in the Form 10-Q that we filed with the Securities and Exchange Commission (the “SEC”) on August 16, 2021, and additional information that will be set forth on our Quarterly Report on Form 10-Q for the quarter ended October 3, 2021 and other documents we have filed, or that we will file, with the SEC. Any forward-looking statements made by us in this letter to shareholders speak only as of the date on which they are made and subsequent events may cause these expectations to change. We disclaim any obligations to update or alter these forward-looking statements in the future, whether as a result of new information, future events or otherwise, except as required by law.
11