Exhibit 99.1
Letter to Our Shareholders
Fellow Shareholders,
During the first quarter of 2022 we achieved two very important milestones: 1) we produced advanced 3D SiliconTM lithium-ion batteries for customers from our first production line for customer qualification, and 2) we announced BrakeFlowTM, a breakthrough in advanced lithium-ion battery safety. This critical innovation was possible due to our unique battery architecture, and we believe it puts considerable distance between us and any competitor that plans to meaningfully increase the energy in its batteries.
The production we’ve begun for a technology leader in the wearable category will allow us to recognize our first product revenue in Q2 2022. This is only the beginning as we have overwhelming demand for our revolutionary battery, which can double the energy density compared to conventional cells, depending on the application.
In addition, we also recently received an initial order from one of the world’s largest consumer electronics companies for our high-energy smartwatch battery. This marks the beginning of the next stage of the customer’s formal product development cycle, which is expected to result in the integration of our batteries into several next generation smartwatch prototype platforms, field trials in pre-production watches and ultimately high-volume production for worldwide consumer markets.
Our revenue funnel was $1.5 billion at the end of Q1 2022, but perhaps more importantly active design and design wins grew to $371 million from $355 million in Q4 2021 as several customers committed to custom cells during the quarter.
Our challenge is not generating demand but fulfilling it to achieve our targeted goal of $1 billion in annual revenue. Meeting demand requires us to build a highly automated manufacturing platform and then replicate it in multiple facilities across the globe over the next several years. This begins next year with our Fab-2 facility.
To equip Fab-2, we’ve begun placing equipment orders for our next-generation (“Gen2”) manufacturing line, which is designed to be faster and require less space than our existing lines at Fab-1 in Fremont (“Gen1”). We expect to take delivery of this equipment in the first half of 2023 at a Fab-2 site to be announced.
Elements of the Gen2 manufacturing line are designed to occupy half the footprint of Gen1 equivalents while increasing output significantly. These improvements are a direct result of incorporating what we learned from operating Gen1 equipment over the last year in Fremont. We are also incorporating BrakeFlowTM into the manufacturing process on Gen2. These space savings and efficiency gains allowed us to avoid leasing a huge million-square-foot facility for Fab-2 earlier this year. We are now focused on a much more efficient facility. We plan on announcing a Fab-2 location later this year to support Gen2 equipment delivery in the first half of 2023. Upon the completion of factory acceptance testing, we intend to order additional Gen2 lines to support our scale-up into 2024.
Geographic diversity in our revenue funnel is accelerating our need to place production capacity in both the U.S. and Asia. A future facility will likely be needed after Fab-2 to localize production. Announcements will be made when sites are finalized, but our goal is clear: install enough capacity to serve at least $1 billion of annualized revenue over the next several years and do so with enhanced equipment.
1
There are multiple strategic paths to commercialize our revolutionary battery architecture. Because we share many common manufacturing processes with battery incumbents, the joint venture/licensing model is an attractive business strategy for opportunities that require more capacity than we can install on our own. During the quarter, we hired strategic business development personnel to our commercial team to actively pursue that strategy.
Scorecard
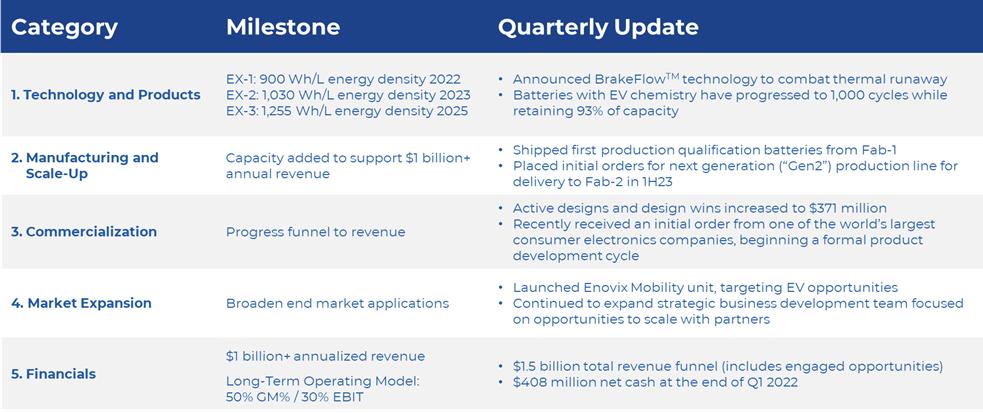
As we progress from a company focused predominantly on R&D and customer sampling to one capable of volume production and commercialization, we believe shareholders should evaluate us across five key areas:
Technology and Products.
In the first quarter we announced BrakeFlowTM, a breakthrough in advanced lithium-ion battery safety.
When a short occurs in a conventional lithium-ion battery, the full energy of the cell can discharge in microseconds, potentially releasing a violent and often fiery chain reaction called “thermal runaway.” Battery fires have caused enormous problems in the industry impacting nearly every end-market from smartphones to PCs to EVs. And as more energy is packed into each cell, the safety bar only gets higher.
BrakeFlowTM coupled with our 3D architecture uniquely addresses the problem of thermal runaway. We announced BrakeFlowTM in March at the International Battery Seminar and it will be available in our batteries next year. Customer response has been overwhelmingly positive. More information is available at: www.enovix.com/brakeflow.
Manufacturing and Scale-Up.
With production underway, our focus in Fab-1 is on increasing volumes and yields. The large majority of the process steps that make up Fab-1 operate today at very high yields. A small number are yielding below 95%, and we have a documented plan to drive these to their targeted yields. Delivering to plan is a journey of many incremental improvements that our operations team undertakes daily. These learnings have given us confidence to move forward with purchases for Fab-2.
During the first quarter we continued to enhance the throughput and automation of Fab-1. This included recently transitioning to an internally developed manufacturing execution system, or MES, to individually
2
track every battery throughout our factory in real-time. It enables comprehensive data tracking that allows us to trace the complete manufacturing history of a battery back to individual machines, process settings and material lots. This allows us to improve our processes and bring the company to a level of digitalization that is a prerequisite to working with some of our most sophisticated customers.
Lastly, we strengthened our strategic relationships within the laser equipment ecosystem to rapidly incorporate improvements in laser speed, quality and precision into our manufacturing process.
Commercialization.
Our revenue funnel at the end of the first quarter of 2022 was $1.5 billion, consisting of $1.11 billion of engaged opportunities and $371 million of active designs and design wins. In order to convert a funnel opportunity to revenue, our batteries must first pass qualification with the customer, then a purchase order is issued before we ship for revenue. The first of these conversions is expected to occur this quarter with a technology leader in the wearable category.
In addition to our first commercial shipment and as noted earlier, we received an initial purchase order from one of the largest consumer electronics companies in the world for our smartwatch battery. This represents our first design with this customer after more than a year of collaboration and testing.
Due to our strong engagements with consumer electronics OEMs in Asia, we have added resources to our applications engineering team and expanded our distributor relationships in the region.
Market Expansion.
New applications for our battery continue to emerge. During the first quarter, we engaged with new customers in product applications such as action cameras, portable gaming, and smartwatches built for children, among others. Because our battery’s energy density enables new features and form factors, we have engagements on products that truly represent new device categories within the wearables umbrella.
For the Electric Vehicles (“EVs”) end-market, we continue to see promising data from our cells that pair a 100% active silicon anode with EV-class cathode materials. These cells recently surpassed 1,000 cycles while retaining 93% of their capacity.
We have formalized our commercialization effort on EVs with the creation of a dedicated business unit called Enovix Mobility. Our team is led by individuals with deep EV experience from Tesla, Samsung SDI and Apple.
Financials.
Our balance sheet remains strong with net cash of $408 million at the end of the first quarter. Capital expenditures in the first quarter of 2022 were approximately $10 million due to the timing of our orders for the Gen2 production line.
Company Strategy
Progress in the first quarter moved us further toward our goal of delivering batteries with record energy densities for industry-leading customers in mobile electronics.
We are targeting this market initially for several reasons:
3
Our near-term focus is on the following market applications: wearables (smartwatches, AR/VR, headsets, etc.), computing, and mobile communications. We estimate the total addressable market for lithium-ion batteries in these markets to be $13 billion in 2025. We are actively sampling to potential customers in these markets and have design wins in each. We believe this strategy will allow us to deliver energy densities years ahead of the competition.
In wearables, we see increased interest from manufacturers of children’s smartwatches. Whereas these products once featured a very simple interface, they are now increasingly being equipped with GPS and cellular capabilities to allow parents to monitor and communicate with their children. This extra functionality also needs to be accomplished in a very small form factor. Those dimensions create a strain on energy requirements, a problem we can uniquely solve with our technology.
In computing, we have multiple engagements with leading PC OEMs who want a step-change increase in energy density to turn PCs into 24-hour, always-on devices. PC OEMs are also drawn to our battery’s abuse tolerance and safety features. Besides BrakeFlowTM with its ability to address thermal runaway, our battery architecture uniquely enables: 1) hotspot reduction and enhanced heat dissipation 2) enhanced protection against crush, pinch and nail penetration due to a stainless-steel constraint system and 3) limited internal movement of the anode, cathode and separator.
In mobile communications, smartphone OEMs continue to rely on software tricks (e.g., adaptive displays) and larger batteries to satisfy the energy consumption of modern-day consumers. In Q421 over half of Android smartphone models carried a battery larger than 5Ah compared to 12% of Android models in Q419, according to Counterpoint Research. This was due in part to the need to compensate for no breakthroughs in energy density. By our analysis, the volumetric energy density of the batteries in the leading smartphone brands in 2021 was flat vs. 2020. Unfortunately, a larger battery takes away space that could be used for enhanced features. As a result of these trends, we have multiple engagements in mobile communications with leading brands.
We believe focusing on these categories ahead of EVs is the right strategy for any advanced battery company because of the economic and time-to-market advantages. Entering the EV battery market requires billions of dollars of capital to build Gigafactories, offers lower prices per kWh than mobile electronics and demands long qualification cycles. We believe the best approach is to start in premium markets where we can leverage our differentiated technology and solidify our manufacturing process while driving toward profitability. At the same time, we are seeding our entry into the EV market by sampling batteries to EV OEMs and demonstrating batteries featuring our 100% active silicon anode paired with EV-class cathode materials. Our goal is to translate this work into partnerships (joint venture or licensing) with automakers or battery OEMs in order to commercialize our technology in this end-market.
Outlook
Our outlook for 2022 is unchanged. We expect to recognize between $6 million and $12 million of revenue, including both product revenue and non-recurring engineering (“NRE”) revenue. In addition to continued
4
activities for yield and throughput improvement, our production lines this year will be busy producing qualification samples to seed future revenue ramps.
For full-year 2022, we expect to use between $190 million and $210 million of cash, roughly 55% of which will come from capital expenditures.
Summary
We continued to make progress in the first quarter of 2022 as we moved toward first commercial production from Fab-1. We brought key customers closer to revenue conversion, including a leading global consumer electronics company. We began ordering our enhanced Gen2 production line destined for Fab-2. We remain squarely focused on driving toward $1 billion of revenue with industry leading margins as we scale beyond Fab-1.
When we founded Enovix, our vision was to build the world’s best battery. We often talk about this in terms of energy density because energy remains the limiting factor in enabling the industries of the future. But we also knew from the start that we couldn’t compromise on safety. That’s why announcing BrakeFlowTM was such a major accomplishment in the first quarter.
Our goals in the second quarter are to 1) continue to drive improvement in output and yield at Fab-1, 2) recognize our first product revenue, 3) increase our revenue funnel, and 4) substantially complete our orders for a Gen2 production line for installation in Fab-2 in the first half 2023.
Quarterly Conference Call and Webcast
Wednesday, May 11 / 2 p.m. PT / 5 p.m. ET
Webcast: ir.enovix.com
Dial-in (U.S. and Canada): (833) 865-1567
Dial-in (International): (574) 990-9731
Passcode: 1892656
5
Enovix Corporation
Consolidated Balance Sheets
(Unaudited)
(In Thousands, Except Share and per Share Amounts)
|
|
April 3, |
|
|
January 2, |
|
||
|
|
2022 |
|
|
2022 |
|
||
Assets |
|
|
|
|
|
|
||
Current assets: |
|
|
|
|
|
|
||
Cash and cash equivalents |
|
$ |
408,178 |
|
|
$ |
385,293 |
|
Deferred contract costs |
|
|
4,547 |
|
|
|
4,554 |
|
Prepaid expenses and other current assets |
|
|
2,824 |
|
|
|
8,274 |
|
Total current assets |
|
|
415,549 |
|
|
|
398,121 |
|
Property and equipment, net |
|
|
83,102 |
|
|
|
76,613 |
|
Operating lease, right-of-use assets |
|
|
6,535 |
|
|
|
6,669 |
|
Other assets, non-current |
|
|
1,105 |
|
|
|
1,162 |
|
Total assets |
|
$ |
506,291 |
|
|
$ |
482,565 |
|
Liabilities, Convertible Preferred Stock and Stockholders’ Equity |
|
|
|
|
|
|
||
Current liabilities: |
|
|
|
|
|
|
||
Accounts payable |
|
$ |
1,535 |
|
|
$ |
3,144 |
|
Accrued expenses |
|
|
4,620 |
|
|
|
7,109 |
|
Accrued compensation |
|
|
4,850 |
|
|
|
4,101 |
|
Deferred revenue |
|
|
5,575 |
|
|
|
5,575 |
|
Other liabilities |
|
|
875 |
|
|
|
707 |
|
Total current liabilities |
|
|
17,455 |
|
|
|
20,636 |
|
Warrant liability |
|
|
56,460 |
|
|
|
124,260 |
|
Operating lease liabilities, non-current |
|
|
8,870 |
|
|
|
9,071 |
|
Deferred revenue, non-current |
|
|
2,290 |
|
|
|
2,290 |
|
Other liabilities, non-current |
|
|
162 |
|
|
|
191 |
|
Total liabilities |
|
|
85,237 |
|
|
|
156,448 |
|
Commitments and Contingencies |
|
|
|
|
|
|
||
Stockholders’ equity: |
|
|
|
|
|
|
||
Common stock, $0.0001 par value; authorized shares of 1,000,000,000; issued and outstanding shares of 156,419,718 and 152,272,287 as of April 3, 2022 and January 2, 2022, respectively |
|
|
15 |
|
|
|
15 |
|
Preferred stock, $0.0001 par value; authorized shares of 10,000,000; none issued and outstanding shares as of April 3, 2022 and January 2, 2022, respectively |
|
|
— |
|
|
|
— |
|
Additional paid-in-capital |
|
|
711,484 |
|
|
|
659,254 |
|
Accumulated deficit |
|
|
(290,445 |
) |
|
|
(333,152 |
) |
Total stockholders’ equity |
|
|
421,054 |
|
|
|
326,117 |
|
Total liabilities, convertible preferred stock and stockholders’ equity |
|
$ |
506,291 |
|
|
$ |
482,565 |
|
6
Enovix Corporation
Consolidated Statements of Operations
(Unaudited)
(In Thousands, Except Share and per Share Amounts)
|
|
For the Quarters Ended |
|
|||||
|
|
April 3, 2022 |
|
|
March 31, 2021 |
|
||
Operating expenses: |
|
|
|
|
|
|
||
Cost of revenue |
|
$ |
515 |
|
|
$ |
1,631 |
|
Research and development |
|
|
12,731 |
|
|
|
5,589 |
|
Selling, general and administrative |
|
|
11,869 |
|
|
|
4,161 |
|
Total operating expenses |
|
|
25,115 |
|
|
|
11,381 |
|
Loss from operations |
|
|
(25,115 |
) |
|
|
(11,381 |
) |
Other income (expense): |
|
|
|
|
|
|
||
Change in fair value of convertible preferred stock warrants and common stock warrants |
|
|
67,800 |
|
|
|
(4,781 |
) |
Other income (expense), net |
|
|
22 |
|
|
|
(3 |
) |
Total other income (expense), net |
|
|
67,822 |
|
|
|
(4,784 |
) |
Net income (loss) |
|
$ |
42,707 |
|
|
$ |
(16,165 |
) |
|
|
|
|
|
|
|
||
Net income (loss) per share, basic |
|
$ |
0.28 |
|
|
$ |
(0.17 |
) |
Weighted average number of common shares outstanding, basic |
|
|
151,648,439 |
|
|
|
95,816,889 |
|
Net loss per share, diluted |
|
$ |
(0.16 |
) |
|
$ |
(0.17 |
) |
Weighted average number of common shares outstanding, diluted |
|
|
153,338,462 |
|
|
|
95,816,889 |
|
7
Enovix Corporation
Consolidated Statements of Cash Flows
(Unaudited)
(In Thousands)
|
|
For the Quarters Ended |
|
|||||
|
|
April 3, 2022 |
|
|
March 31, 2021 |
|
||
Cash flows from operating activities: |
|
|
|
|
|
|
||
Net income (loss) |
|
$ |
42,707 |
|
|
$ |
(16,165 |
) |
Adjustments to reconcile net loss to net cash used in operating activities |
|
|
|
|
|
|
||
Depreciation |
|
|
314 |
|
|
|
141 |
|
Amortization of right-of-use assets |
|
|
134 |
|
|
|
— |
|
Stock-based compensation expense |
|
|
5,238 |
|
|
|
1,555 |
|
Changes in fair value of convertible preferred stock warrants and common stock warrants |
|
|
(67,800 |
) |
|
|
4,781 |
|
Prepaid expenses and other assets |
|
|
(51 |
) |
|
|
1,039 |
|
Deferred contract costs |
|
|
8 |
|
|
|
(816 |
) |
Accounts payable |
|
|
(959 |
) |
|
|
1,172 |
|
Accrued expenses and compensation |
|
|
555 |
|
|
|
1,260 |
|
Other liabilities |
|
|
165 |
|
|
|
(1,577 |
) |
Net cash used in operating activities |
|
|
(19,689 |
) |
|
|
(8,610 |
) |
Cash flows from investing activities: |
|
|
|
|
|
|
||
Purchase of property and equipment |
|
|
(10,451 |
) |
|
|
(7,141 |
) |
Net cash used in investing activities |
|
|
(10,451 |
) |
|
|
(7,141 |
) |
Cash flows from financing activities: |
|
|
|
|
|
|
||
Payments of transaction costs related to Business Combination and PIPE financing |
|
|
— |
|
|
|
(332 |
) |
Proceeds from exercise of common stock warrants |
|
|
52,828 |
|
|
|
— |
|
Proceeds from exercise of convertible preferred stock warrants |
|
|
— |
|
|
|
102 |
|
Proceeds from the exercise of stock options |
|
|
200 |
|
|
|
159 |
|
Repurchase of unvested restricted common stock |
|
|
(3 |
) |
|
|
(5 |
) |
Net cash provided by (used in) financing activities |
|
|
53,025 |
|
|
|
(76 |
) |
Change in cash, cash equivalents, and restricted cash |
|
|
22,885 |
|
|
|
(15,827 |
) |
Cash and cash equivalents and restricted cash, beginning of period |
|
|
385,418 |
|
|
|
29,218 |
|
Cash and cash equivalents and restricted cash, end of period |
|
$ |
408,303 |
|
|
$ |
13,391 |
|
|
|
|
|
|
|
|
||
8
Net Loss to Adjusted EBITDA
While we prepare our condensed consolidated financial statements in accordance with GAAP, we also utilize and present certain financial measures that are not based on GAAP. We refer to these financial measures as “Non-GAAP” financial measures. In addition to our financial results determined in accordance with GAAP, we believe that EBITDA and Adjusted EBITDA are useful measures in evaluating its financial and operational performance distinct and apart from financing costs, certain non-cash expenses and non-operational expenses.
These Non-GAAP financial measures should be considered in addition to results prepared in accordance with GAAP but should not be considered a substitute for or superior to GAAP. We endeavor to compensate for the limitation of the Non-GAAP financial measures presented by also providing the most directly comparable GAAP measures.
We use Non-GAAP financial information to evaluate our ongoing operations and for internal planning, budgeting and forecasting purposes. We believe that Non-GAAP financial information, when taken collectively, may be helpful to investors in assessing its operating performance and comparing its performance with competitors and other comparable companies. You should review the reconciliations below but not rely on any single financial measure to evaluate our business.
“EBITDA” is defined as earnings (net loss) adjusted for interest expense; income taxes; depreciation expense, and amortization expense. “Adjusted EBITDA” includes additional adjustments to EBITDA such as stock-based compensation expense; change in fair value of convertible preferred stock warrants, common stock warrants and convertible promissory notes; and other special items as determined by management which it does not believe to be indicative of its underlying business trends.
Below is a reconciliation of net income (loss) on a GAAP basis to the Non-GAAP EBITDA and Adjusted EBITDA financial measures for the periods presented below (in thousands):
|
|
For the Quarters Ended |
|
|
|||||
|
|
April 3, 2022 |
|
|
March 31, 2021 |
|
|
||
Net income (loss) |
|
$ |
42,707 |
|
|
$ |
(16,165 |
) |
|
Depreciation and amortization |
|
|
448 |
|
|
|
141 |
|
|
EBITDA |
|
|
43,155 |
|
|
|
(16,024 |
) |
|
Stock-based compensation expense |
|
|
5,238 |
|
|
|
1,418 |
|
|
Change in fair value of convertible preferred stock warrants and common stock warrants |
|
|
(67,800 |
) |
|
|
4,781 |
|
|
Adjusted EBITDA |
|
$ |
(19,407 |
) |
|
$ |
(9,825 |
) |
|
9
Free Cash Flow
Below is a reconciliation of net cash used in operating activities to the Free Cash Flow financial measures for the periods presented below (in thousands):
|
|
For the Quarters Ended |
|
|||||
|
|
April 3, 2022 |
|
|
March 31, 2021 |
|
||
Net cash used in operating activities |
|
$ |
(19,689 |
) |
|
$ |
(8,610 |
) |
Capital expenditures |
|
|
(10,451 |
) |
|
|
(7,141 |
) |
Free Cash Flow (1) |
|
$ |
(30,140 |
) |
|
$ |
(15,751 |
) |
(1) |
We define “Free Cash Flow” as (i) net cash from operating activities less (ii) capital expenditures, net of proceeds from disposals of property and equipment, all of which are derived from our condensed consolidated statements of cash flow. The presentation of non-GAAP Free Cash Flow is not intended as an alternative measure of cash flows from operations, as determined in accordance with GAAP. We believe that this financial measure is useful to investors because it provides investors to view our performance using the same tool that we use to gauge our progress in achieving our goals and it is an indication of cash flow that may be available to fund investments in future growth initiatives. |
10
Other Non-GAAP Financial Measures Reconciliation
|
|
For the Quarters Ended |
|
|
|||||
|
|
April 3, 2022 |
|
|
March 31, 2021 |
|
|
||
Costs of revenue |
|
$ |
515 |
|
|
$ |
1,631 |
|
|
GAAP gross margin |
|
|
(515 |
) |
|
|
(1,631 |
) |
|
Stock-based compensation expense |
|
|
— |
|
|
|
(274 |
) |
|
Non-GAAP gross margin |
|
$ |
(515 |
) |
|
$ |
(1,905 |
) |
|
|
|
|
|
|
|
|
|
||
GAAP research and development expense |
|
$ |
12,731 |
|
|
$ |
5,589 |
|
|
Stock-based compensation expense |
|
|
(2,512 |
) |
|
|
(959 |
) |
|
Non-GAAP research and development expense |
|
$ |
10,219 |
|
|
$ |
4,630 |
|
|
|
|
|
|
|
|
|
|
||
GAAP selling, general and administrative expense |
|
$ |
11,869 |
|
|
$ |
4,161 |
|
|
Stock-based compensation expense |
|
|
(2,726 |
) |
|
|
(185 |
) |
|
Non-GAAP selling, general and administrative expense |
|
$ |
9,143 |
|
|
$ |
3,976 |
|
|
|
|
|
|
|
|
|
|
||
GAAP loss from operations |
|
$ |
(25,115 |
) |
|
$ |
(11,381 |
) |
|
Stock-based compensation expense |
|
|
(5,238 |
) |
|
|
(1,418 |
) |
|
Non-GAAP loss from operations |
|
$ |
(19,877 |
) |
|
$ |
(9,963 |
) |
|
|
|
|
|
|
|
|
|
||
GAAP net income (loss) |
|
$ |
42,707 |
|
|
$ |
(16,165 |
) |
|
Stock-based compensation expense |
|
|
5,238 |
|
|
|
1,418 |
|
|
Change in fair value of convertible preferred stock warrants and common stock warrants |
|
|
(67,800 |
) |
|
|
4,781 |
|
|
Non-GAAP net loss |
|
$ |
(19,855 |
) |
|
$ |
(9,966 |
) |
|
|
|
|
|
|
|
|
|
||
GAAP net income (loss) per share, basic |
|
$ |
0.28 |
|
|
$ |
(0.17 |
) |
|
GAAP weighted average number of common shares outstanding, basic |
|
|
151,648,439 |
|
|
|
95,816,889 |
|
|
|
|
|
|
|
|
|
|
||
GAAP net loss per share, diluted |
|
$ |
(0.16 |
) |
|
$ |
(0.17 |
) |
|
GAAP weighted average number of common shares outstanding, diluted |
|
|
153,338,462 |
|
|
|
95,816,889 |
|
|
|
|
|
|
|
|
|
|
||
Non-GAAP net loss per share, basic |
|
$ |
(0.13 |
) |
|
$ |
(0.10 |
) |
|
GAAP weighted average number of common shares outstanding, diluted |
|
|
151,648,439 |
|
|
|
95,816,889 |
|
|
|
|
|
|
|
|
|
|
||
Non-GAAP net loss per share, diluted |
|
$ |
(0.13 |
) |
|
$ |
(0.10 |
) |
|
GAAP weighted average number of common shares outstanding, diluted |
|
|
153,338,462 |
|
|
|
95,816,889 |
|
|
Management’s Use of Non-GAAP Financial Measures
EBITDA, Adjusted EBITDA, Free Cash Flow and other non-GAAP measures are intended as supplemental financial measures of our performance that are neither required by, nor presented in accordance with GAAP. We believe that the use of Non-GAAP measures provides an additional tool for investors to use in evaluating
11
ongoing operating results, trends, and in comparing our financial measures with those of comparable companies, which may present similar Non-GAAP financial measures to investors.
However, you should be aware that when evaluating the non-GAAP measures, we may incur future expenses similar to those excluded when calculating these measures. In addition, the presentation of these measures should not be construed as an inference that our future results will be unaffected by unusual or nonrecurring items. Our computation of EBITDA, Adjusted EBITDA, Free Cash Flow and other Non-GAAP measures may not be comparable to other similarly titled measures computed by other companies, because all companies may not calculate the Non-GAAP measures in the same fashion.
Forward-Looking Statements
This letter to shareholders contains forward-looking statements within the meaning of Section 27A of the Securities Act of 1933, as amended, and Section 21E of the Securities Exchange Act of 1934, as amended, about us and our industry that involve substantial risks and uncertainties. Forward-looking statements generally relate to future events or our future financial or operating performance. In some cases, you can identify forward-looking statements because they contain words such as “believe”, “will”, “may”, “estimate”, “continue”, “anticipate”, “intend”, “should”, “plan”, “expect”, “predict”, “could”, “potentially", “target”, “project”, “evaluate,” “emerge,” “focus,” “goal” or the negative of these terms or similar expressions. Forward-looking statements in this letter to shareholders include, but are not limited to, statements regarding our ability to respond to customer demand and the strength of such demand, our financial and business performance, our product revenue, service revenue and projections thereof, our ability to advance to the next stage of our customer’s commercial procurement process, opportunities across multiple categories within our customer’s vast portfolio of products, the integration of Enovix’ batteries into several of our customer’s next generation smartwatch prototype platforms, field trials in pre-production watches and ultimately high-volume production for worldwide consumer markets, the production of the batteries at Enovix’ automated production lines at its factory in Fremont, Calif, the building of a highly automated manufacturing platform and its replication in multiple facilities across the globe over the next several years, the placement of equipment orders for our next-generation (“Gen2”) manufacturing line, the speed of and space requirements for the Gen2 manufacturing line relative to our existing lines at Fab-1 in Fremont (“Gen1”), the selection of a Fab-2 location later this year, Gen2 equipment delivery in the first half of 2023, the ordering of additional Gen2 lines to support our scale-up into 2024, the acquisition of a future facility after Fab-2 to localize production, the ability to install enough capacity to serve at least $1 billion of annualized revenue over the next several years with enhanced equipment, availability of BrakeFlow in our batteries next year, ability to drive targeted yields, the improvement of our processes and bringing the company to a level of digitalization that is a prerequisite to working with some of our most sophisticated customers, rapidly incorporate improvements in laser speed, quality and precision into our manufacturing process, conversion of funnel opportunities to revenue this quarter with a technology leader in the wearable category, emergence of new applications for our batteries, our ability to build and scale our advanced silicon-anode lithium-ion battery, capitalizing on our learning from our first production line, optimizing our manufacturing process, our production and commercialization timeline, our ability to meet milestones and deliver on our objectives and expectations, the implementation and success of our business model and growth strategy, various addressable markets, market opportunity and the expansion of our customer base, power future industries with our technology, new engagements in Asia-based markets and market expansion (including wearable, computing, mobile communications and EV) and new customer engagements, our ability to meet the expectations of new and current customers, our projections regarding energy density, the progress of our cells using an EV-class NMC cathode, the progress and results of our program with the U.S. Department of Energy, roadmap and the future demand for our lithium ion battery solutions, and the strategies, objectives, expectations, intentions and financial performance and the assumptions that underlie these statements. Actual results could differ materially from these forward-looking statements as a result of certain risks and uncertainties,
12
including, without limitation, our ability to improve energy density among our products, our ability to establish sufficient manufacturing and optimize manufacturing processes to meet demand, sourcing or establishing supply relationships, adequate funds to acquire our next manufacturing facility, market acceptance of our products, changes in consumer preferences or demands, changes in industry standards, the impact of technological development and competition, and global economic conditions, including inflationary and supply chain pressures as well as effects of the COVID-19 pandemic, and political, social, and economic instability, including as a result of armed conflict, war or threat of war, terrorist activity or other security concerns or trade and other international disputes that could disrupt supply or delivery of, or demand for, our products. For additional information on these risks and uncertainties and other potential factors that could affect our business and financial results or cause actual results to differ from the results predicted, please refer to our filings with the Securities and Exchange Commission (the “SEC”), including in the “Risk Factors” and “Management’s Discussion and Analysis of Financial Condition and Results of Operations” sections of our most recently filed periodic reports on Form 10-K and other documents that we have filed, or that we will file, with the SEC. Any forward-looking statements made by us in this letter to shareholders speak only as of the date on which they are made and subsequent events may cause these expectations to change. We disclaim any obligations to update or alter these forward-looking statements in the future, whether as a result of new information, future events or otherwise, except as required by law.
13