Exhibit 99.1
Letter to Our Shareholders
Fellow Shareholders,
For the second quarter of 2022, we reported first revenue, consisting of approximately $5.1 million of service revenue and a small contribution from commercial battery cells. This met a commitment we made in February 2021, when we projected first product revenue from Fab-1 in Fremont in Q2 2022.
Service revenue for the second quarter included $5.0 million from a single customer based on the shipment of commercial cells from Fab-1 and our completion of various milestones of a product development program that included the design, development, and shipment of custom validation cells.
Overall, we shipped Fab-1 cells to 10 OEMs and four distributors globally in the quarter. These cells will be used for a combination of prototypes, product qualifications and end products for field trials.
Reaching commercialization has accelerated activity with our Strategic Accounts. These are “mega cap” technology companies whose market capitalizations exceed $200 billion, are household names, and dominate the world’s consumer electronic markets. We believe the next generation technology race will be won by companies like these that take advantage of the coming revolution in battery performance. Our strategy has been to establish deep, high-integrity technical relationships with these Strategic Accounts, in many cases over several years. And then to capture a design win in a cutting-edge product that demands the type of energy density improvements we can uniquely deliver. Significantly, we completed technology qualifications with three of these Strategic Accounts in the second quarter. Also, a fourth Strategic Account drove the large service revenue we recognized in the quarter. These accounts alone present the opportunity for Enovix to grow exponentially in the years ahead.
Another program of strategic importance is for the U.S. Army. In the second quarter, we were awarded a follow-on evaluation contract to build and test custom cells for the Conformal Wearable Battery (CWB) program. Our partner on the program is Inventus Power, who developed the CWB for the U.S. Army in 2010. We estimate that the potential size of the total U.S. wearable military battery market is approximately $350 million annually based on currently established military programs, of which the CWB is a majority.
Reaching commercial shipments is a major validation point for our company. To meet our projected future demand, we need to increase our manufacturing throughput and yield metrics. Meeting our goals will be a multi-quarter endeavor. In the third quarter we are prioritizing manufacturing improvements over shipments. This includes taking portions of our first production line down to install planned automated conveyance and implementing throughput and reliability enhancements for multiple process modules. Looking ahead, we target bringing up the assembly section of our second line in Fab-1 by year-end. We expect to exit 2023 producing annualized output of single-digit millions of units from both manufacturing lines combined in Fab-1.
Design win activity for our products continued to be strong during the quarter. Our total revenue funnel is approximately $1.5 billion. Active designs and design wins in our funnel increased to $414 million in Q2 2022 from $371 million in Q1 2022. We increased our total number of design wins to eight (up from five Y/Y) and began multiple new product qualification programs. At the end of the second quarter, there were more than 75 accounts (nearly double Y/Y) in the revenue funnel, with broad representation across geography and product applications.
As noted earlier, we advanced the U.S. Army program in the second quarter. As a U.S. manufacturer, we are well positioned to provide a domestic supply of batteries for the military. The Enovix cell has the potential to nearly double the energy density of the current CWB while 1) providing a layer of safety that is unmatched in our industry, and 2) meeting the program’s stringent requirements.
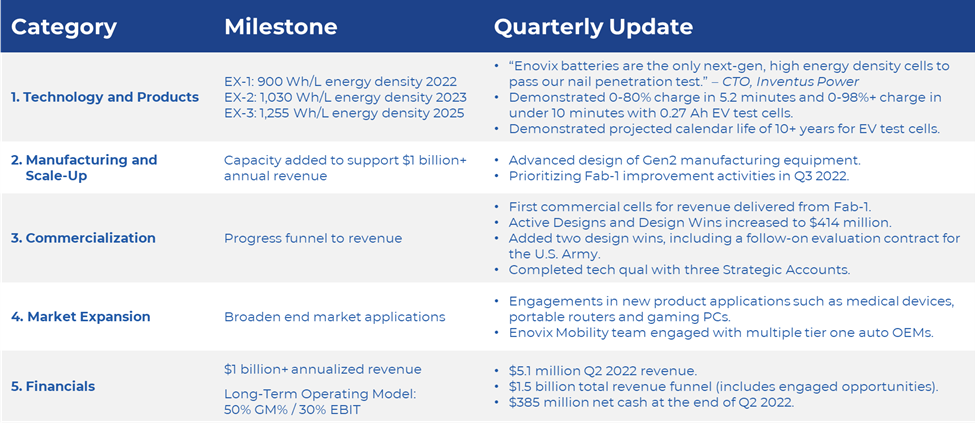
This breakthrough is enabled by BrakeFlow™, our internal cell safety technology. According to Inventus Power, the longtime provider of CWB packs for the Army, “Enovix batteries are the only next-gen, high energy density cells to pass our nail penetration test. We look forward to collaborating with the company on this program, to provide an even more resilient, high-energy battery to the U.S. Army.”
For an overview of BrakeFlowTM, how it works, and what makes it so compelling, we have posted a demonstration and explanation of the technology on our website featuring our Chairman, T.J. Rodgers at www.enovix.com/fromthelab.
Scorecard
As we progress from a company focused predominantly on R&D and customer sampling to one capable of volume production and commercialization, we believe shareholders should evaluate us across five key areas, described in our first shareholder letter in August 2021:
Technology and Products.
Fast Charge: During the second quarter, we demonstrated that our 0.27 Ah test cells with cathode chemistries common in batteries for Electric Vehicles (“EVs”) had the ability to charge from 0-80% state-of-charge in as little as 5.2 minutes. This is an exceptional result, uniquely enabled by our battery design, which we estimate dissipates heat nearly 5x faster than comparable conventional cells. Fast charging is also enabled by our use of a 100% active silicon anode, which gives us electrochemical advantages relative to graphite and silicon-graphite blends for higher charge rates.
BrakeFlowTM: We shipped Enovix batteries that incorporated our BrakeFlowTM technology to Inventus Power to perform nail penetration test on these cells, in support of our U.S. Army program. Multiple tests were performed in July, successfully validating our unique safety technology.
Calendar Life: In support of our U.S. Department of Energy program, we demonstrated in the second quarter that after six months at elevated temperatures (30-50C), Enovix batteries had minimal capacity loss. We now have nine months of data that validate our projection for calendar life of greater than 10 years based on our EV test cells. Historically, low calendar life (<10 years) has been a significant barrier to the adoption of silicon anodes in EV batteries.
Manufacturing and Scale-Up.
During the second quarter, we furthered the design of our Gen2 manufacturing equipment with our suppliers but did not complete ordering. This is due to the incorporation of the latest learning from Fab-1 and to a lesser extent, the incorporation of our BrakeFlowTM technology into the equipment. As a result, we are now targeting full delivery of this equipment in the second half of 2023 followed by our Agility Line for accelerated product development and qualification. We view our Gen2 line as a significant inflection in our ability to scale as major elements of this manufacturing line are designed to occupy half the footprint of Gen1 while increasing output significantly.
In parallel to our work on Gen2, we have continued the site selection process for our future factory locations. As previously communicated, we anticipate splitting this capacity increase into two battery cell factories, one in North America and one in Asia (now known as Fab-2 and Fab-3). Our current goal is to develop these sites in succession. A domestic factory will allow close collaboration with our R&D site and access to potential policy incentives through both the Department of Energy and the Department of Defense. A factory in Asia will most effectively serve consumer electronics customers with localized production.
Commercialization.
Our revenue funnel at the end of the second quarter of 2022 was $1.5 billion, consisting of $1.09 billion of engaged opportunities and $414 million of active designs and design wins. Our commercial team is focused on driving engagements down the funnel with sampling, product qualifications and custom cell development.
During the second quarter we continued to make progress in driving the 75+ accounts in our funnel toward signed commercial agreements. Highlights include:
•Added 12 new accounts to the funnel after initial business and technical discussions.
•Completed technology qualification with three Strategic Accounts that have the potential to use our batteries in multiple product applications.
•Shipped qualification cells from Fab-1 to accounts across wearable, medical, and industrial applications.
Market Expansion.
Additional use cases for our battery continue to emerge. During the second quarter, we achieved our first design win in the medical device category. Additionally, we engaged new opportunities in applications such as handheld payment terminals, portable routers, and gaming PCs.
For EVs, we are actively pursuing partnership strategies with leading automotive OEMs and various U.S. Department of Energy programs.
Financials.
Second quarter total revenue was $5.1 million, with one customer accounting for $5.0 million of total revenue.
Our second quarter GAAP gross profit was a loss of $0.6 million, or a loss of $0.4 million on a Non-GAAP basis (excluding stock-based compensation). In the beginning of June, we completed constructing our first production line, and placed this equipment in service. As a result, we began depreciating this production equipment over its estimated useful life. We also began capitalizing inventory and recognizing factory overhead expenses in cost of goods sold, which are largely fixed overhead costs (idle costs) that were previously recognized in R&D expenses. We expect equipment depreciation and idle costs to increase from the second quarter level going forward given full quarter versus partial quarter recognition. Our second quarter GAAP operating expenses were $27.4 million, up from $14.1 million in the second quarter of 2021. Non-GAAP operating expenses of $19.5 million were up from $11.8 million in the second quarter of 2021 and up from $19.4 million in the first quarter of 2022. On a year over year basis, the increase in operating expenses was primarily driven by headcount increases attributable to manufacturing and added resources in selling, general and administrative support.
Our second quarter GAAP loss was $1.1 million, or a basic loss of $0.01 per share, which included a $26.4 million benefit from the quarterly change in the fair value of the liability for our private warrants. On a Non-GAAP basis, our second quarter net loss was $19.4 million, or a loss of $0.13 per share.
Second quarter adjusted EBITDA was a loss of $18.0 million, compared to an adjusted EBITDA loss of $11.7 million in the second quarter of 2021 and an adjusted EBITDA loss of $19.4 million in the first quarter of 2022. Adjusted EBITDA excludes the change in fair value for the liability of our private warrants as well as stock-based compensation.
A full reconciliation of our GAAP to Non-GAAP results is available later in this document.
Our balance sheet is strong with net cash of $385 million at the end of the second quarter. Capital expenditures in the second quarter of 2022 were approximately $4.0 million due to the timing of our orders for Gen2 production line and the Agility line.
Company Strategy
Product commercialization began in the second quarter, as we delivered cells with leading energy density into the portable electronics market.
We are targeting this market initially for several reasons:
1.High-energy density is a critical need for product designers in the portable electronics market. The unprecedented energy density of our cells allows these designers to deliver new features and form factors for their products
2.Batteries often make up a small fraction of the cost of premium portable electronics, which gives us the opportunity to earn premium average selling prices and margins given the value assigned to higher energy density.
3.Consumer electronics design and qualification cycles are significantly shorter than other applications such as automotive, enabling quicker volume production and revenue realization.
Our near-term focus is on the following market applications: wearables (smartwatches, AR/VR, headsets, etc.), computing, and mobile communications. We estimate the total addressable market for lithium-ion batteries in these markets to be $13 billion in 2025. We are actively sampling to potential customers in these markets and have design wins in each. Most importantly, though, we believe this strategy will allow us to deliver energy densities years ahead of the competition.
In wearables we have active engagements with over 25 brands, including five of the top seven smartwatch brands by unit shipments in 2021. Smartwatch OEMs continue to prioritize enhanced features such as health and fitness monitoring paired with extended battery life. We are also seeing new form factors emerge in wearables such as fitness rings, hearables and connected eyewear (AR). We have engagements across all these product applications as our battery’s leading energy density enables enhanced product designs and features, and in some cases, products that could not exist without out battery.
In computing, we have engagements with multiple notebook PC OEMs, including the top 3 brands by unit shipments in 2021. Recent advances in processor technology can in some circumstances drive battery life as high as 18 hours in notebook PCs, yet the promise remains elusive for an always-on, all-day device. Delivering on this promise is driving our engagements in the category, which we expect to translate into shipments of our battery for this product application starting in 2024.
In mobile communications, we are engaged across a range of end market applications, including smartphones, land mobile radios for both public safety and military, and enterprise mobile computing devices. In the smartphone category, our battery is drawing interest from OEMs in Asia.
We believe focusing on these portable electronics market applications ahead of EVs is the right strategy for any advanced battery company because of the economic and time-to-market advantages. Entering the EV battery market requires billions of dollars of capital to build Gigafactories, offers lower prices per kWh than mobile electronics and demands long qualification cycles. We believe the best approach is to start in premium markets where we can leverage our differentiated technology and solidify our manufacturing process while striving toward profitability. At the same time, we are seeding our entry into the EV market by sampling batteries to EV OEMs and demonstrating batteries featuring our 100% active silicon anode paired with EV-class cathode materials. Our goal is to translate this work into partnerships (joint venture or licensing) with automakers or battery OEMs to commercialize our technology in this end-market.
Outlook
We now expect between $6 million and $8 million of revenue for full-year 2022 based on our prioritization of improvement activities in the Fab-1 during the current quarter over shipments. We continue to expect our revenue to consist of product and service revenue, with service revenue being a significant factor.
For full-year 2022, we now expect to use between $160 million and $180 million of cash, roughly half of which will come from capital expenditures. We are lowering our cash use guidance primarily due to the timing of our capital equipment orders.
Summary
In the second quarter, we achieved the most significant milestone in our company’s history, shipping commercial cells from Fab-1 to multiple leading customers. This achievement met an ambitious target we set forth nearly 18 months ago and required a significant cross-functional effort.
We are entering a very exciting time for the company and the industry. We believe battery technology choices made by large strategic customers in the coming years may separate the winners from the losers in a next generation technology race across everything from mobile devices to EVs to AR.
We are squarely focused on driving toward $1 billion of revenue with industry leading margins in the coming years as we scale beyond Fab-1, and in parallel pursue joint ventures and licensing arrangements.
Our goals in the third quarter are to 1) make planned improvements in Fab-1 to enhance yield and throughput 2) continue to advance customers toward design wins and revenue and 3) strengthen our Strategic Account relationships.
Quarterly Conference Call and Webcast
Wednesday, August 10 / 2 p.m. PT / 5 p.m. ET
Dial-in details: https://register.vevent.com/register/BId293346f5b2f45cfbfccd730f3f6f294
Webcast: ir.enovix.com
Enovix Corporation
Condensed Consolidated Balance Sheets
(Unaudited)
(In Thousands, Except Share and per Share Amounts)
| | | | | | | | | | | |
| July 3,
2022 | | January 2,
2022 |
| Assets | | | |
| Current assets: | | | |
| Cash and cash equivalents | $ | 384,730 | | | $ | 385,293 | |
| Accounts receivable, net | 102 | | | — | |
| Inventory | 669 | | | — | |
| Deferred contract costs | 1,340 | | | 4,554 | |
| Prepaid expenses and other current assets | 2,026 | | | 8,274 | |
| Total current assets | 388,867 | | | 398,121 | |
| Property and equipment, net | 90,932 | | | 76,613 | |
| Operating lease, right-of-use assets | 6,407 | | | 6,669 | |
| | | |
| Other assets, non-current | 1,049 | | | 1,162 | |
| Total assets | $ | 487,255 | | | $ | 482,565 | |
| Liabilities and Stockholders’ Equity | | | |
| Current liabilities: | | | |
| Accounts payable | $ | 6,133 | | | $ | 3,144 | |
| Accrued expenses | 3,357 | | | 7,109 | |
| Accrued compensation | 6,579 | | | 4,101 | |
| Deferred revenue | 275 | | | 5,575 | |
| Other liabilities | 722 | | | 707 | |
| Total current liabilities | 17,066 | | | 20,636 | |
| Warrant liability | 30,060 | | | 124,260 | |
| Operating lease liabilities, non-current | 8,661 | | | 9,071 | |
| Deferred revenue, non-current | 2,590 | | | 2,290 | |
| Other liabilities, non-current | 138 | | | 191 | |
| Total liabilities | 58,515 | | | 156,448 | |
| Commitments and Contingencies | | | |
| Stockholders’ equity: | | | |
| Common stock, $0.0001 par value; authorized shares of 1,000,000,000; issued and outstanding shares of 156,678,690 and 152,272,287 as of July 3, 2022 and January 2, 2022, respectively | 15 | | | 15 | |
| Preferred stock, $0.0001 par value; authorized shares of 10,000,000; no shares issued or outstanding as of July 3, 2022 and January 2, 2022, respectively | — | | | — | |
| Additional paid-in-capital | 720,305 | | | 659,254 | |
| Accumulated deficit | (291,580) | | | (333,152) | |
| Total stockholders’ equity | 428,740 | | | 326,117 | |
| Total liabilities and stockholders’ equity | $ | 487,255 | | | $ | 482,565 | |
Enovix Corporation
Condensed Consolidated Statements of Operations
(Unaudited)
(In Thousands, Except Share and per Share Amounts)
| | | | | | | | | | | | | | | | | | | | | | | |
| Quarters Ended | | Years-to-Date Ended |
| July 3, 2022 | | June 30, 2021 | | July 3, 2022 | | June 30, 2021 |
| | | | | | | |
| | | | | | | |
| | | | | | | |
| Revenue | $ | 5,101 | | | $ | — | | | $ | 5,101 | | | $ | — | |
| | | | | | | |
| | | | | | | |
| | | | | | | |
| Cost of revenue | 5,739 | | | 112 | | | 6,254 | | | 1,743 | |
| Gross margin | (638) | | | (112) | | | (1,153) | | | (1,743) | |
| Operating expenses: | | | | | | | |
| Research and development | 15,827 | | | 9,523 | | | 28,558 | | | 15,112 | |
| Selling, general and administrative | 11,566 | | | 4,548 | | | 23,435 | | | 8,709 | |
| Total operating expenses | 27,393 | | | 14,071 | | | 51,993 | | | 23,821 | |
| Loss from operations | (28,031) | | | (14,183) | | | (53,146) | | | (25,564) | |
| Other income (expense): | | | | | | | |
| Change in fair value of convertible preferred stock warrants and common stock warrants | 26,400 | | | — | | | 94,200 | | | (4,781) | |
| | | | | | | |
| | | | | | | |
| Interest expense, net | — | | | (135) | | | — | | | (135) | |
| Other income (expense), net | 496 | | | 15 | | | 518 | | | 12 | |
| Total other income (expense), net | 26,896 | | | (120) | | | 94,718 | | | (4,904) | |
| Net income (loss) | $ | (1,135) | | | $ | (14,303) | | | $ | 41,572 | | | $ | (30,468) | |
| | | | | | | |
| Net income (loss) per share, basic | $ | (0.01) | | | $ | (0.15) | | | $ | 0.27 | | | $ | (0.32) | |
| Weighted average number of common shares outstanding, basic | 152,521,389 | | | 97,433,726 | | | 152,082,655 | | | 96,629,530 | |
| Net income (loss) per share, diluted | $ | (0.18) | | | $ | (0.15) | | | $ | (0.34) | | | $ | (0.32) | |
| Weighted average number of common shares outstanding, diluted | 152,521,389 | | | 97,433,726 | | | 152,924,803 | | | 96,629,530 | |
Enovix Corporation
Condensed Consolidated Statements of Cash Flows
(Unaudited)
(In Thousands)
| | | | | | | | | | | |
| Years-to-Date Ended |
| July 3, 2022 | | June 30, 2021 |
| Cash flows from operating activities: | | | |
| Net income (loss) | $ | 41,572 | | | $ | (30,468) | |
| Adjustments to reconcile net income (loss) to net cash used in operating activities | | | |
| Depreciation | 1,531 | | | 375 | |
| Amortization of right-of-use assets | 269 | | | — | |
| Stock-based compensation expense | 13,418 | | | 3,675 | |
| Changes in fair value of convertible preferred stock warrants and common stock warrants | (94,200) | | | 4,781 | |
| | | |
| | | |
| | | |
| | | |
| Changes in operating assets and liabilities: | | | |
| Accounts receivable | (102) | | | — | |
| Inventory | (669) | | | — | |
| Prepaid expenses and other assets | 613 | | | 493 | |
| Deferred contract costs | 3,214 | | | (693) | |
| Accounts payable | 249 | | | 3,904 | |
| Accrued expenses and compensation | (1,191) | | | 1,592 | |
| Deferred revenue | (5,000) | | | 1,100 | |
| | | |
| Other liabilities | (3) | | | 99 | |
| Net cash used in operating activities | (40,299) | | | (15,142) | |
| Cash flows from investing activities: | | | |
| Purchase of property and equipment | (14,473) | | | (20,573) | |
| Net cash used in investing activities | (14,473) | | | (20,573) | |
| Cash flows from financing activities: | | | |
| | | |
| Payments of transaction costs related to Business Combination and PIPE financing | — | | | (3,592) | |
| Proceeds from exercise of common stock warrants, net | 52,828 | | | — | |
| | | |
| Proceeds from secured promissory notes, converted promissory notes and paycheck protection program loan | — | | | 14,910 | |
| Proceeds from issuance of common stock under employee stock purchase plan | 1,112 | | | — | |
| | | |
| | | |
| Proceeds from exercise of convertible preferred stock warrants | — | | | 102 | |
| Proceeds from the exercise of stock options | 277 | | | 163 | |
| Repurchase of unvested restricted common stock | (8) | | | (10) | |
| Net cash provided by financing activities | 54,209 | | | 11,573 | |
| Change in cash, cash equivalents, and restricted cash | (563) | | | (24,142) | |
| Cash and cash equivalents and restricted cash, beginning of period | 385,418 | | | 29,218 | |
| Cash and cash equivalents, and restricted cash, end of period | $ | 384,855 | | | $ | 5,076 | |
Net Loss to Adjusted EBITDA
While we prepare our condensed consolidated financial statements in accordance with GAAP, we also utilize and present certain financial measures that are not based on GAAP. We refer to these financial measures as “Non-GAAP” financial measures. In addition to our financial results determined in accordance with GAAP, we believe that EBITDA and Adjusted EBITDA are useful measures in evaluating its financial and operational performance distinct and apart from financing costs, certain non-cash expenses and non-operational expenses.
These Non-GAAP financial measures should be considered in addition to results prepared in accordance with GAAP but should not be considered a substitute for or superior to GAAP. We endeavor to compensate for the limitation of the Non-GAAP financial measures presented by also providing the most directly comparable GAAP measures.
We use Non-GAAP financial information to evaluate our ongoing operations and for internal planning, budgeting and forecasting purposes. We believe that Non-GAAP financial information, when taken collectively, may be helpful to investors in assessing its operating performance and comparing its performance with competitors and other comparable companies. You should review the reconciliations below but not rely on any single financial measure to evaluate our business.
“EBITDA” is defined as earnings (net loss) adjusted for interest expense; income taxes; depreciation expense, and amortization expense. “Adjusted EBITDA” includes additional adjustments to EBITDA such as stock-based compensation expense; change in fair value of convertible preferred stock warrants, common stock warrants and convertible promissory notes; and other special items as determined by management which it does not believe to be indicative of its underlying business trends.
Below is a reconciliation of net income (loss) on a GAAP basis to the Non-GAAP EBITDA and Adjusted EBITDA financial measures for the periods presented below (in thousands):
| | | | | | | | | | | | | | | | | | | | | | | |
| Quarters Ended | | Years-to-Date Ended |
| July 3, 2022 | | June 30, 2021 | | July 3, 2022 | | June 30, 2021 |
| Net income (loss) | $ | (1,135) | | | $ | (14,303) | | | $ | 41,572 | | | $ | (30,468) | |
| Interest expense, net | — | | | 135 | | | — | | | 135 | |
| | | | | | | |
| Depreciation and amortization | 1,352 | | | 234 | | | 1,800 | | | 375 | |
| EBITDA | 217 | | | (13,934) | | | 43,372 | | | (29,958) | |
| Stock-based compensation expense | 8,180 | | | 2,257 | | | 13,418 | | | 3,675 | |
| Change in fair value of convertible preferred stock warrants and common stock warrants | (26,400) | | | — | | | (94,200) | | | 4,781 | |
| | | | | | | |
| | | | | | | |
| | | | | | | |
| Adjusted EBITDA | $ | (18,003) | | | $ | (11,677) | | | $ | (37,410) | | | $ | (21,502) | |
Free Cash Flow
We define “Free Cash Flow” as (i) net cash from operating activities less (ii) capital expenditures, net of proceeds from disposals of property and equipment, all of which are derived from our Condensed Consolidated Statements of Cash Flow. The presentation of non-GAAP Free Cash Flow is not intended as an alternative measure of cash flows from operations, as determined in accordance with GAAP. We believe that this financial measure is useful to investors because it provides investors to view our performance using the same tool that we use to gauge our progress in achieving our goals and it is an indication of cash flow that may be available to fund investments in future growth initiatives. Below is a reconciliation of net cash used in operating activities to the Free Cash Flow financial measures for the periods presented below (in thousands):
| | | | | | | | | | | |
| Years-to-Date Ended |
| July 3, 2022 | | June 30, 2021 |
| Net cash used in operating activities | $ | (40,299) | | | $ | (15,142) | |
| Capital expenditures | (14,473) | | | (20,573) | |
| Free Cash Flow | $ | (54,772) | | | $ | (35,715) | |
Other Non-GAAP Financial Measures Reconciliation
| | | | | | | | | | | | | | | | | | | | | | | | | | |
| | Quarters Ended | | Years-to-Date Ended |
| | July 3, 2022 | | June 30, 2021 | | July 3, 2022 | | June 30, 2021 |
| Revenue: | | | | | | | | |
| | | | | | | | |
| | | | | | | | |
| Revenue | | $ | 5,101 | | | $ | — | | | $ | 5,101 | | | $ | — | |
| | | | | | | | |
| | | | | | | | |
| | | | | | | | |
| | | | | | | | |
| GAAP cost of revenue | | $ | 5,739 | | | $ | 112 | | | $ | 6,254 | | | $ | 1,743 | |
| Stock-based compensation expense | | (250) | | | — | | | (250) | | | (274) | |
| Non-GAAP cost of revenue | | $ | 5,489 | | | $ | 112 | | | $ | 6,004 | | | $ | 1,469 | |
| | | | | | | | |
| GAAP gross margin | | $ | (638) | | | $ | (112) | | | $ | (1,153) | | | $ | (1,743) | |
| Stock-based compensation expense | | (250) | | | — | | | (250) | | | (274) | |
| Non-GAAP gross margin | | $ | (388) | | | $ | (112) | | | $ | (903) | | | $ | (1,469) | |
| | | | | | | | |
| GAAP research and development expense | | $ | 15,827 | | | $ | 9,523 | | | $ | 28,558 | | | $ | 15,112 | |
| Stock-based compensation expense | | (3,821) | | | (1,948) | | | (6,333) | | | (2,907) | |
| Non-GAAP research and development expense | | $ | 12,006 | | | $ | 7,575 | | | $ | 22,225 | | | $ | 12,205 | |
| | | | | | | | |
| GAAP selling, general and administrative expense | | $ | 11,566 | | | $ | 4,548 | | | $ | 23,435 | | | $ | 8,709 | |
| Stock-based compensation expense | | (4,109) | | | (309) | | | (6,835) | | | (494) | |
| Non-GAAP selling, general and administrative expense | | $ | 7,457 | | | $ | 4,239 | | | $ | 16,600 | | | $ | 8,215 | |
| | | | | | | | |
| GAAP loss from operations | | $ | (28,031) | | | $ | (14,183) | | | $ | (53,146) | | | $ | (25,564) | |
| Stock-based compensation expense | | (8,180) | | | (2,257) | | | (13,418) | | | (3,675) | |
| Non-GAAP loss from operations | | $ | (19,851) | | | $ | (11,926) | | | $ | (39,728) | | | $ | (21,889) | |
| | | | | | | | |
| GAAP net income (loss) | | $ | (1,135) | | | $ | (14,303) | | | $ | 41,572 | | | $ | (30,468) | |
| Stock-based compensation expense | | 8,180 | | | 2,257 | | | 13,418 | | | 3,675 | |
| Change in fair value of convertible preferred stock warrants and common stock warrants | | (26,400) | | | — | | | (94,200) | | | 4,781 | |
| | | | | | | | |
| | | | | | | | |
| | | | | | | | |
| Non-GAAP net loss | | $ | (19,355) | | | $ | (12,046) | | | $ | (39,210) | | | $ | (22,012) | |
| | | | | | | | |
| GAAP net income (loss) per share, basic | | $ | (0.01) | | | $ | (0.15) | | | $ | 0.27 | | | $ | (0.32) | |
| GAAP weighted average number of common shares outstanding, basic | | 152,521,389 | | | 97,433,726 | | | 152,082,655 | | | 96,629,530 | |
| | | | | | | | |
| GAAP net loss per share, diluted | | $ | (0.18) | | | $ | (0.15) | | | $ | (0.34) | | | $ | (0.32) | |
| GAAP weighted average number of common shares outstanding, diluted | | 152,521,389 | | | 97,433,726 | | | 152,924,803 | | | 96,629,530 | |
| | | | | | | | |
| Non-GAAP net loss per share, basic | | $ | (0.13) | | | $ | (0.12) | | | $ | (0.26) | | | $ | (0.23) | |
| GAAP weighted average number of common shares outstanding, basic | | 152,521,389 | | | 97,433,726 | | | 152,082,655 | | | 96,629,530 | |
| | | | | | | | |
| Non-GAAP net loss per share, diluted | | $ | (0.13) | | | $ | (0.12) | | | $ | (0.26) | | | $ | (0.23) | |
| GAAP weighted average number of common shares outstanding, diluted | | 152,521,389 | | | 97,433,726 | | | 152,924,803 | | | 96,629,530 | |
| | | | | | | | |
Management’s Use of Non-GAAP Financial Measures
EBITDA, Adjusted EBITDA, Free Cash Flow and other non-GAAP measures are intended as supplemental financial measures of our performance that are neither required by, nor presented in accordance with GAAP. We believe that the use of Non-GAAP measures provides an additional tool for investors to use in evaluating ongoing operating results, trends, and in comparing our financial measures with those of comparable companies, which may present similar Non-GAAP financial measures to investors.
However, you should be aware that when evaluating the non-GAAP measures, we may incur future expenses similar to those excluded when calculating these measures. In addition, the presentation of these measures should not be construed as an inference that our future results will be unaffected by unusual or nonrecurring items. Our computation of EBITDA, Adjusted EBITDA, Free Cash Flow and other Non-GAAP measures may not be comparable to other similarly titled measures computed by other companies, because all companies may not calculate the Non-GAAP measures in the same fashion.
Forward-Looking Statements
This letter to shareholders contains forward-looking statements within the meaning of Section 27A of the Securities Act of 1933, as amended, and Section 21E of the Securities Exchange Act of 1934, as amended, about us and our industry that involve substantial risks and uncertainties. Forward-looking statements generally relate to future events or our future financial or operating performance. In some cases, you can identify forward-looking statements because they contain words such as “will,” “goal,” “prioritize,” “plan,” “target,” “expect,” “focus,” “look forward,” “opportunity,” “believe,” “estimate,” “continue,” “anticipate,” and “pursue” or the negative of these terms or similar expressions. Forward-looking statements in this letter to shareholders include, but are not limited to, statements regarding our ability respond to customer demand and the strength of such demand, our financial and business performance, our ability to accelerate customer engagements through the commercialization of our batteries, our plans to build and test Conformal Wearable Battery packs for the U.S. Army, including achieving the expected energy density and safety profiles of such packs, our integration of our BrakeFlow technology into our batteries, shipments of our wearables class cell to OEMs and distributors for use in prototypes, product qualifications, and end products for field trials, our ability to meet goals for yield and throughput, including plans to prioritize improvement in manufacturing yield and throughout over shipments, our plans to bring up the assembly section of our second line in Fab-1 by year-end 2022 and exit 2023 producing a yielded annualized output of single-digit millions of units on both manufacturing lines combined in Fab-1, our revenue funnel and our ability to advance customers from funnel opportunities to design wins and revenue, our battery design and estimates that heat dissipates nearly 5x faster than comparable conventional cells, our plans to fully deliver Gen2 manufacturing equipment in the second half of 2023 followed by our Agility Line, our site selection process for our future factory locations (Fab-2 and Fab-3), including the timing thereof and plans to split our next capacity into two battery cells in North America and Asia and localize production, our ability to strengthen relationships with strategic accounts, our pursuit of partnerships with automotive OEMs and the U.S. Department of Energy, increases in our equipment depreciation and idle facility costs, our focus on the portable electronics market, our estimates of the total addressable market for lithium-ion batteries in the wearables, computing, and mobile communications markets, our ability to commence battery shipments in the computing market in 2024, interest in our batteries from smartphone OEMs in Asia, our strategy and plans to engage in the EV battery market, including pursuing joint venture or licensing partnerships with automakers or battery OEMs, emergence of new applications for our batteries, our ability to meet milestones and deliver on our objectives and expectations, the implementation and success of our business model and growth strategy, including targeting various addressable markets and the expansion of our customer base, our forecasts of our financial and performance guidance and metrics, and our ability to produce industry leading margins. Actual results could differ materially from these forward-looking statements as a result of certain risks and uncertainties, including, without limitation, our ability to improve energy density among our products, our ability to establish sufficient manufacturing and optimize manufacturing processes to meet demand, sourcing or establishing supply relationships, adequate funds to acquire our next manufacturing facility, market acceptance of our products, changes in consumer preferences or demands, changes in industry standards, the impact of technological development and competition, and global economic conditions, including inflationary and supply chain pressures as well as effects of the COVID-19 pandemic, and political, social, and economic instability, including as a result of armed conflict, war or threat of war, terrorist activity or other security concerns or trade and other international disputes that could disrupt supply or delivery of, or demand for, our products. For additional information on these risks and uncertainties and other potential factors that could affect our
business and financial results or cause actual results to differ from the results predicted, please refer to our filings with the Securities and Exchange Commission (the “SEC”), including in the “Risk Factors” and “Management’s Discussion and Analysis of Financial Condition and Results of Operations” sections of our most recently filed annual report on Form 10-K and quarterly report on Form 10-Q and other documents that we have filed, or that we will file, with the SEC. Any forward-looking statements made by us in this letter to shareholders speak only as of the date on which they are made and subsequent events may cause these expectations to change. We disclaim any obligations to update or alter these forward-looking statements in the future, whether as a result of new information, future events or otherwise, except as required by law.