Exhibit 99.1
Letter to Our Shareholders
Fellow Shareholders,
In the third quarter of 2022, we made steady operational progress in Fab-1 that allowed us to improve yield while also continuing to ship cells from our production line for qualification programs and pre-production end-product builds. Production cells were shipped to 25 OEMs, including three Strategic Accounts, a tier one lithium-ion battery OEM and a top-10 global automotive OEM.
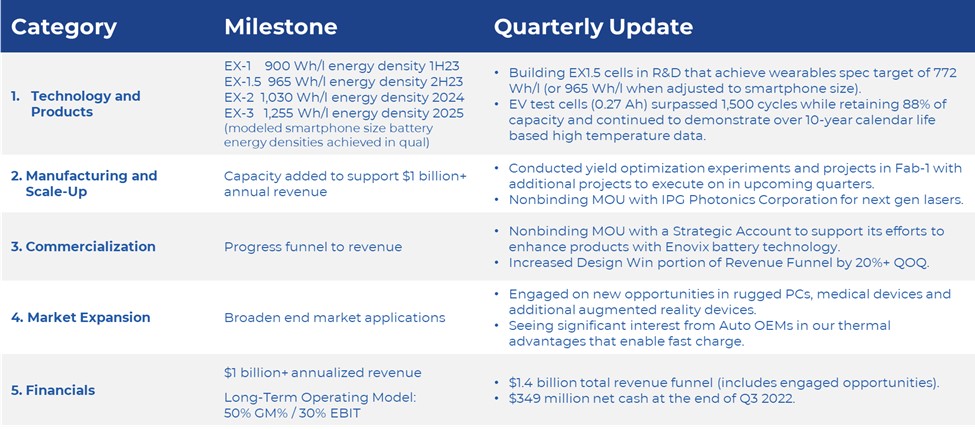
We further solidified our relationships with Strategic Accounts (mega-cap technology companies with multiple portable electronics product applications). Notably, today we are announcing a non-binding Memorandum of Understanding (“MOU”) with one of these Strategic Accounts to work to incorporate our cells into wearable, mobile and computing applications. This follows a purchase order we received from this customer earlier this year, which led to testing of our cells and has culminated in this agreement which establishes a framework for the deployment and scale-up of our technology across their product portfolio.
In addition, we recently received a purchase order from another Strategic Account for our small cells for a wearable product. We are deeply engaged with this customer, which spans across three different product groups and multiple product applications where our battery can make a meaningful impact.
We continue to grow our global reach and have active engagements across Asia, including with leading smartphone OEMs in China and major consumer brands in Japan and Korea, including Samsung.
As we highlighted in last quarter’s Shareholder Letter, we made a conscious decision to focus on manufacturing improvements over shipments in Fab-1 during the third quarter. We conducted numerous yield optimization experiments and projects. We made encouraging progress on yields but there is more work to be done in the coming quarters. Importantly, this Gen1 manufacturing improvement work is proving invaluable to the parallel activity of designing our first Gen2 Autoline, which we view as the engine that will power our manufacturing scale-up in the future. Working with world-class equipment vendors over the past several quarters, our Gen1 and Gen2 engineering teams have identified and incorporated over 120 process and design improvements into Gen2. Incorporating these improvements is expected to result in higher speed manufacturing of our battery (up to 10x), resulting in lower cost per unit and greater flexibility to change battery sizes relative to Gen1.
Given the wide gap in expected performance between our Gen1 and Gen2 and the slower-than-expected improvements on our Gen1 manufacturing equipment, we have now concluded that the incremental effort necessary to drive higher throughput on Gen1 technology is better spent on the critical yield and productivity learning necessary for a strong launch of our Gen2 Autoline. As a result, we are dialing back Gen1 throughput enhancement activities and anticipate achieving lower overall output from Fab-1 in 2023 in favor of focusing on the Gen2 Autoline, which is the engine for our future scaling.
During the third quarter, we continued to work closely with three key vendors to further the design of the critical path elements of our Gen2 Autoline. Over the last six months, these vendors have significantly advanced the detailed design of these systems, incorporating the Gen1 learnings to validate the new Gen2 high-speed equipment design concepts. During the quarter we placed initial purchase orders for our laser patterning assembly and packaging lines for long-lead equipment, design, and proof-of-concept hardware fabrication to demonstrate the design improvements built into Gen2. We have subsequently placed a follow-on purchase order for the remainder of our Gen2 packaging line and expect to do the same for our Gen2 laser patterning systems and assembly line in the coming weeks. Other non-critical path equipment will be ordered thereafter. Subject to final technical design approval and Board approval scheduled for early 2023, we continue to target full delivery of our Gen2 equipment in the second half of 2023, followed by our Gen2 compatible Agility Line for accelerated product development and qualification.
We plan to bring additional Gen2 Autolines up over the course of 2024 in conjunction with the timing of customer programs. We expect that certain customers may require up to several months to qualify the Gen2 line before accepting product that is manufactured on that line. The Gen2 Autoline will also be our “copy exact” blueprint for supporting future licensing and joint ventures with existing customers and battery companies.
With a large revenue funnel amassed over the last two years, our focus with customers is on 1) driving engagements through qualification and design stages toward revenue and 2) deepening our relationships with Strategic Accounts. Notably in Q3 2022, we grew the design win portion of our revenue funnel by 20%+ QoQ thanks to progress on a program with a Strategic Account. With a funnel that is well beyond our current capacity, we are prioritizing our engagements with accounts that get the greatest benefit from our battery attributes (energy density, fast charge, safety) and have the potential to use us in multiple end applications.
Finally, to help investors better understand our scale up, we are forecasting that a complete Gen2 Autoline that can produce both small and large cells will cost between $50 million and $70 million of capital expenditures and at 80% overall equipment effectiveness (“OEE”) will produce just over nine million cells annually once fully ramped. We have separately started the development of a dedicated line for wearables-size batteries that can make four times as many cells in a similar footprint. Given our premium pricing model and projected product mix, we believe these future lines are supportive of our long-term margin model (50% GM%/30% EBIT%).
Scorecard
As we progress from a company focused predominantly on R&D and customer sampling to one capable of volume production and commercialization, we believe shareholders should evaluate us across the same five key areas we described in our first shareholder letter in August 2021:
Technology and Products.
During the third quarter, we continued to see excellent data from our EV test cells in support of high cycle life and high calendar life – two attributes that have historically held back cells with silicon anodes. Our test cells with chemistries common in batteries for Electric Vehicles (“EVs”) surpassed 1,500 cycles while retaining 88% of their capacity – well ahead of the program’s goal of 1,000 cycles with 80% capacity retention. Additionally, our test cells put to cycling under extreme temperatures have retained enough capacity for us to comfortably model over 10 years of calendar life, a key requirement for EVs.
In Fab-1, we are producing cells that hit our wearables cell EX-1 target for energy density at 714 Wh/l (900 Wh/l when adjusted to smartphone size) and are in cycling for qualification in early 2023. Also, cells built on our R&D line that have achieved our EX1.5 target of 772 Wh/l for wearables (965 Wh/l when adjusted to smartphone size) were put into cycling during the third quarter, in support of our energy density roadmap.
Manufacturing and Scale-Up.
In the third quarter, we worked to optimize our first production line (“Line 1”) in Fab-1 for higher yield and throughput, bring up our second production line in Fab-1 (“Line 2”), and complete our learnings for Gen2. We expect Fab-1 improvement activities to extend into 2023, but at a slower rate given the decision to redirect resources to Gen2. Given this, we expect to exit 2023 at a run rate of under one million battery cells produced
from the Gen1 equipment at Fab-1. There is opportunity for significant outperformance dependent on the timing of the completion of ongoing Fab-1 improvement projects. We plan to focus Fab-1 on a handful of high-profile consumer product launches and ongoing qualification programs with Strategic Accounts, which positions us for significant growth in 2024. Like 2022, we would expect service revenue to again be a meaningful factor in our 2023 total revenue.
One of our key focus areas for improving throughput and productivity in Gen2 is upgrading the lasers we use to pattern our electrodes and weld certain elements of the battery together. We have recently added photonics talent, and today we are announcing a non-binding MOU for a collaboration with IPG Photonics Corporation (NASDAQ: IPGP), the leader in high-power fiber laser technology to develop cutting edge, next-generation laser tooling and methods to optimize cell manufacturing processes. Our alliance with IPG provides ongoing access to the most advanced laser technologies and has already resulted in our Gen2 lasers having 5x the power of our current Gen1 lasers, far ahead of our original scale-up plan.
Commercialization.
Our revenue funnel at the end of the third quarter of 2022 was $1.4 billion, consisting of $1.0 billion of engaged opportunities and $423 million of active designs and design wins. Our commercial team is focused on driving engagements down the funnel with sampling, product qualifications and custom cell development.
During the third quarter we continued to make progress in driving the 75+ accounts in our funnel toward signed commercial agreements. Highlights include:
•Increased design wins to nine as we made progress on a program with a Strategic Account.
•Shipped qualification cells from Fab-1 to accounts across wearable, medical, automotive, and industrial applications.
•Shipped large cells with BrakeFlowTM safety technology from our R&D pilot line to customers for safety testing.
Market Expansion.
Additional use cases for our battery continue to emerge. During the third quarter, we engaged opportunities in new categories such as ruggedized laptops, two-way radios, medical devices, and additional augmented reality opportunities.
For EVs, we are actively pursuing partnership strategies with leading automotive OEMs led by our Enovix Mobility team. In multiple cases, we are working toward joint development agreements (JDAs) to prove out the benefits of the Enovix 3D architecture, with notable interest around our thermal advantages enabling fast charge.
Financials.
Third quarter total revenue was eight thousand dollars, which consisted of a modest number of batteries shipped to customers for qualification programs and pre-production end-product builds. The majority of batteries shipped during the quarter were samples that did not generate revenue.
Our third quarter GAAP gross profit was a loss of $6.6 million, or a loss of $5.6 million on a Non-GAAP basis (excluding stock-based compensation). Our third quarter GAAP operating expenses were $27.1 million, up from $19.1 million in the third quarter of 2021. Non-GAAP operating expenses of $19.4 million were up from $16.1 million in the third quarter of 2021 and down from $19.5 million in the second quarter of 2022. On a year over year basis, the increase in operating expenses was primarily driven by headcount increases attributable to manufacturing and added resources in selling, general and administrative support.
Our third quarter GAAP loss was $82.0 million, or a basic and diluted loss of $0.53 per share, which included a $50.2 million loss from the quarterly change in the fair value of the liability for our private warrants. On a Non-GAAP basis, our third quarter net loss was $23.2 million, or a loss of $0.15 per share.
Third quarter adjusted EBITDA was a loss of $20.2 million, compared to an adjusted EBITDA loss of $15.5 million in the third quarter of 2021 and an adjusted EBITDA loss of $18.0 million in the second quarter of 2022.
Adjusted EBITDA excludes the change in fair value for the liability of our private warrants as well as stock-based compensation.
A full reconciliation of our GAAP to Non-GAAP results is available later in this letter.
Our balance sheet is strong with net cash of $349.0 million at the end of the third quarter. Capital expenditures in the third quarter of 2022 were $16.9 million.
Company Strategy
Product commercialization began in Q2 2022, as we delivered cells with leading energy density into the portable electronics market.
We are targeting this market initially for several reasons:
1.High-energy density is a critical need for product designers in the portable electronics market. The unprecedented energy density of our cells allows these designers to deliver new features and form factors for their products, not merely longer charging intervals.
2.Batteries often make up a small fraction of the cost of premium portable electronics, which gives us the opportunity to earn premium average selling prices and margins given the value assigned to higher energy density.
3.Consumer electronics design and qualification cycles are significantly shorter than other applications such as automotive, enabling quicker volume production and revenue realization.
Our near-term focus is on the following market applications: wearables (smartwatches, AR/VR, headsets, etc.), computing, and mobile communications. We estimate the total addressable market for lithium-ion batteries in these markets to be $13 billion in 2025. We are actively sampling to potential customers in these markets and have design wins in each. Most importantly, though, we believe this strategy will allow us to deliver energy densities years ahead of the competition.
In wearables we are increasingly seeing OEMs wanting to develop new categories of body-worn devices outside of the traditional smartwatch category. These devices need to be small and unobtrusive, yet powerful, and thus they require a breakthrough in energy density which we are uniquely capable of supplying. We note that Counterpoint Research estimates that wearable devices worn outside the wrist (earwear, eyewear, bodywear, skinwear and limbwear) will grow to over 500 million units by 2025, up from over 12 million units in 2015. We have also recently seen OEMs developing specific smartwatch SKUs that offer multi-day and multi-week experiences. That task today is largely being accomplished through increasing the watch’s size to accommodate a larger battery. With our technology, OEMs have the flexibility to either further increase the runtime with a less bulky form factor or extend runtime and features beyond the state-of-the-art today.
In computing, laptop power budget demands continue to increase as business travel resumes to normal and users expect a full day of battery life, just as they get with their smartphone. Additionally, we continue to see demand for gaming PCs, which today only offer an hour or so of battery life while gaming unplugged. We are well-positioned to provide a solution and as a result are engaged with multiple industry leaders.
In mobile communications, we are continuing to see a trend of rising smartphone average selling prices (ASPs). According to Counterpoint Research, sales of smartphones priced $1,000 and higher grew 94% YoY in Q2 2022. Rising ASPs can be attributed to the addition of premium features such as 5G, enhanced cameras, artificial intelligence (AI) for faster processing and high-fidelity video/audio. Not surprisingly, these enhanced features increase the power budget, and the result has been larger batteries going into these smartphones. Thus, to keep this trend going, it will require higher battery capacities in the future but accomplished within the limitations of today’s device sizes. This trend plays perfectly into our strategy of enhancing energy density and capacity.
We believe focusing on these portable electronics market applications ahead of EVs is the right strategy for any advanced battery company because of the economic and time-to-market advantages. Entering the EV battery market requires billions of dollars of capital to build Gigafactories, offers lower prices per kWh than mobile electronics and demands long qualification cycles. We believe the best approach is to start in premium
markets where we can leverage our differentiated technology and solidify our manufacturing process while striving toward profitability. At the same time, we are seeding our entry into the EV market by sampling batteries to EV OEMs and demonstrating batteries featuring our 100% active silicon anode paired with EV-class cathode materials. Our goal is to translate this work into partnerships (joint venture or licensing) with automakers or battery OEMs to commercialize our technology in this end-market.
Outlook
We continue to expect between $6 million and $8 million of revenue for full-year 2022 with service revenue being a significant factor.
For full-year 2022, we now expect to use between $130 million and $150 million of cash, roughly 40% of which will come from capital expenditures. Nominally we expect to exit the year with $300 million of cash. We are lowering our cash use guidance primarily due to the timing of capital expenditures payments for the Agility Line and final payments for the first Gen2 Autoline pushed to 2023.
Summary
In the third quarter, we continued to seed our commercialization efforts with Fab-1 shipments of qualification batteries while driving yield improvement activities. This work has assisted our design and procurement of Gen2 equipment as our team has identified over 120 process and design improvements from Gen1. We made progress with Strategic Accounts which included a new design win with one of these accounts, and a cooperation agreement with one of the world’s largest consumer electronics companies.
Our goals for the fourth quarter are to 1) complete the design process of all Gen2 equipment and 2) make substantive improvement in productivity and yield in Fab-1 (in turn benefitting the Gen2 launch).
Quarterly Conference Call and Webcast
Tuesday, November 1 / 2 p.m. PT / 5 p.m. ET
Dial-in details: Available here.
Webcast: ir.enovix.com
Enovix Corporation
Condensed Consolidated Balance Sheets
(Unaudited)
(In Thousands, Except Share and per Share Amounts)
| | | | | | | | | | | |
| October 2,
2022 | | January 2,
2022 |
| Assets | | | |
| Current assets: | | | |
| Cash and cash equivalents | $ | 349,007 | | | $ | 385,293 | |
| Accounts receivable, net | 6 | | | — | |
| Inventory | 452 | | | — | |
| Deferred contract costs | 1,539 | | | 4,554 | |
| Prepaid expenses and other current assets | 4,507 | | | 8,274 | |
| Total current assets | 355,511 | | | 398,121 | |
| Property and equipment, net | 103,991 | | | 76,613 | |
| Operating lease, right-of-use assets | 6,270 | | | 6,669 | |
| | | |
| Other assets, non-current | 1,787 | | | 1,162 | |
| Total assets | $ | 467,559 | | | $ | 482,565 | |
| Liabilities and Stockholders’ Equity | | | |
| Current liabilities: | | | |
| Accounts payable | $ | 6,816 | | | $ | 3,144 | |
| Accrued expenses | 2,476 | | | 7,109 | |
| Accrued compensation | 6,169 | | | 4,101 | |
| Deferred revenue | 1,373 | | | 5,575 | |
| Other liabilities | 695 | | | 707 | |
| Total current liabilities | 17,529 | | | 20,636 | |
| Warrant liability | 80,220 | | | 124,260 | |
| Operating lease liabilities, non-current | 8,449 | | | 9,071 | |
| Deferred revenue, non-current | 2,964 | | | 2,290 | |
| Other liabilities, non-current | 114 | | | 191 | |
| Total liabilities | 109,276 | | | 156,448 | |
| Commitments and Contingencies | | | |
| Stockholders’ equity: | | | |
| Common stock, $0.0001 par value; authorized shares of 1,000,000,000; issued and outstanding shares of 157,077,599 and 152,272,287 as of October 2, 2022 and January 2, 2022, respectively | 15 | | | 15 | |
| Preferred stock, $0.0001 par value; authorized shares of 10,000,000; no shares issued or outstanding as of October 2, 2022 and January 2, 2022, respectively | — | | | — | |
| Additional paid-in-capital | 731,861 | | | 659,254 | |
| Accumulated deficit | (373,593) | | | (333,152) | |
| Total stockholders’ equity | 358,283 | | | 326,117 | |
| Total liabilities and stockholders’ equity | $ | 467,559 | | | $ | 482,565 | |
Enovix Corporation
Condensed Consolidated Statements of Operations
(Unaudited)
(In Thousands, Except Share and per Share Amounts)
| | | | | | | | | | | | | | | | | | | | | | | |
| Quarters Ended | | Fiscal Years-to-Date Ended |
| October 2, 2022 | | October 3, 2021 | | October 2, 2022 | | October 3, 2021 |
| | | | | | | |
| | | | | | | |
| | | | | | | |
| Revenue | $ | 8 | | | $ | — | | | $ | 5,109 | | | $ | — | |
| | | | | | | |
| | | | | | | |
| | | | | | | |
| Cost of revenue | 6,629 | | | 104 | | | 12,883 | | | 1,847 | |
| Gross margin | (6,621) | | | (104) | | | (7,774) | | | (1,847) | |
| Operating expenses: | | | | | | | |
| Research and development | 13,948 | | | 10,301 | | | 42,506 | | | 25,413 | |
| Selling, general and administrative | 13,110 | | | 8,791 | | | 36,545 | | | 17,500 | |
| Total operating expenses | 27,058 | | | 19,092 | | | 79,051 | | | 42,913 | |
| Loss from operations | (33,679) | | | (19,196) | | | (86,825) | | | (44,760) | |
| Other income (expense): | | | | | | | |
| Change in fair value of convertible preferred stock warrants and common stock warrants | (50,160) | | | 8,460 | | | 44,040 | | | 3,679 | |
| | | | | | | |
| | | | | | | |
| Interest expense, net | — | | | (52) | | | — | | | (187) | |
| Other income (expense), net | 1,826 | | | (50) | | | 2,344 | | | (38) | |
| Total other income (expense), net | (48,334) | | | 8,358 | | | 46,384 | | | 3,454 | |
| Net loss | $ | (82,013) | | | $ | (10,838) | | | $ | (40,441) | | | $ | (41,306) | |
| | | | | | | |
| Net loss per share, basic | $ | (0.53) | | | $ | (0.08) | | | $ | (0.27) | | | $ | (0.38) | |
| Weighted average number of common shares outstanding, basic | 153,332,007 | | | 133,492,216 | | | 152,497,010 | | | 109,317,614 | |
| Net loss per share, diluted | $ | (0.53) | | | $ | (0.14) | | | $ | (0.55) | | | $ | (0.45) | |
| Weighted average number of common shares outstanding, diluted | 153,332,007 | | | 135,052,128 | | | 153,773,271 | | | 109,854,540 | |
Enovix Corporation
Condensed Consolidated Statements of Cash Flows
(Unaudited)
(In Thousands)
| | | | | | | | | | | |
| Fiscal Years-to-Date Ended |
| October 2, 2022 | | October 3, 2021 |
| Cash flows from operating activities: | | | |
| Net loss | $ | (40,441) | | | $ | (41,306) | |
| Adjustments to reconcile net loss to net cash used in operating activities | | | |
| Depreciation | 4,388 | | | 674 | |
| Amortization of right-of-use assets | 407 | | | 388 | |
| Stock-based compensation | 22,117 | | | 6,717 | |
| Changes in fair value of convertible preferred stock warrants and common stock warrants | (44,040) | | | (3,679) | |
| | | |
| | | |
| Loss on early debt extinguishment | — | | | 60 | |
| | | |
| Changes in operating assets and liabilities: | | | |
| Accounts receivable | (6) | | | — | |
| Inventory | (452) | | | — | |
| Prepaid expenses and other assets | (2,004) | | | (1,645) | |
| Deferred contract costs | 3,015 | | | (1,279) | |
| Accounts payable | (192) | | | (357) | |
| Accrued expenses and compensation | (122) | | | 3,173 | |
| Deferred revenue | (3,527) | | | 2,290 | |
| | | |
| Other liabilities | (46) | | | 450 | |
| Net cash used in operating activities | (60,903) | | | (34,514) | |
| Cash flows from investing activities: | | | |
| Purchase of property and equipment | (31,366) | | | (31,509) | |
| Net cash used in investing activities | (31,366) | | | (31,509) | |
| Cash flows from financing activities: | | | |
| Proceeds from Business Combination and PIPE financing | — | | | 405,155 | |
| Payments of transaction costs related to Business Combination and PIPE financing | — | | | (29,641) | |
| Proceeds from exercise of common stock warrants, net | 52,828 | | | — | |
| | | |
| Proceeds from secured promissory notes, converted promissory notes and paycheck protection program loan | — | | | 15,000 | |
| Repayment of secured promissory note | — | | | (15,000) | |
| Payment of debt issuance costs | — | | | (90) | |
| Proceeds from exercise of convertible preferred stock warrants | — | | | 102 | |
| Proceeds from the exercise of stock options | 2,052 | | | 163 | |
| Proceeds from issuance of common stock under employee stock purchase plan | 1,112 | | | — | |
| Repurchase of unvested restricted common stock | (9) | | | (13) | |
| Net cash provided by financing activities | 55,983 | | | 375,676 | |
| Change in cash, cash equivalents, and restricted cash | (36,286) | | | 309,653 | |
| Cash and cash equivalents and restricted cash, beginning of period | 385,418 | | | 29,218 | |
| Cash and cash equivalents, and restricted cash, end of period | $ | 349,132 | | | $ | 338,871 | |
Net Loss to Adjusted EBITDA
While we prepare our condensed consolidated financial statements in accordance with GAAP, we also utilize and present certain financial measures that are not based on GAAP. We refer to these financial measures as “Non-GAAP” financial measures. In addition to our financial results determined in accordance with GAAP, we believe that EBITDA and Adjusted EBITDA are useful measures in evaluating its financial and operational performance distinct and apart from financing costs, certain non-cash expenses and non-operational expenses.
These Non-GAAP financial measures should be considered in addition to results prepared in accordance with GAAP but should not be considered a substitute for or superior to GAAP. We endeavor to compensate for the limitation of the Non-GAAP financial measures presented by also providing the most directly comparable GAAP measures.
We use Non-GAAP financial information to evaluate our ongoing operations and for internal planning, budgeting and forecasting purposes. We believe that Non-GAAP financial information, when taken collectively, may be helpful to investors in assessing its operating performance and comparing its performance with competitors and other comparable companies. You should review the reconciliations below but not rely on any single financial measure to evaluate our business.
“EBITDA” is defined as earnings (net loss) adjusted for interest expense; income taxes; depreciation expense, and amortization expense. “Adjusted EBITDA” includes additional adjustments to EBITDA such as stock-based compensation expense; change in fair value of convertible preferred stock warrants, common stock warrants and convertible promissory notes; and other special items as determined by management which it does not believe to be indicative of its underlying business trends.
Below is a reconciliation of net loss on a GAAP basis to the Non-GAAP EBITDA and Adjusted EBITDA financial measures for the periods presented below (in thousands):
| | | | | | | | | | | | | | | | | | | | | | | |
| Quarters Ended | | Fiscal Years-to-Date Ended |
| October 2, 2022 | | October 3, 2021 | | October 2, 2022 | | October 3, 2021 |
| Net loss | $ | (82,013) | | | $ | (10,838) | | | $ | (40,441) | | | $ | (41,306) | |
| Interest expense, net | — | | | 52 | | | — | | | 187 | |
| | | | | | | |
| Depreciation and amortization | 2,995 | | | 687 | | | 4,795 | | | 1,062 | |
| EBITDA | (79,018) | | | (10,099) | | | (35,646) | | | (40,057) | |
| Stock-based compensation expense | 8,699 | | | 3,042 | | | 22,117 | | | 6,717 | |
| Change in fair value of convertible preferred stock warrants and common stock warrants | 50,160 | | | (8,460) | | | (44,040) | | | (3,679) | |
| | | | | | | |
| | | | | | | |
| Loss on early debt extinguishment | — | | | 60 | | | — | | | 60 | |
| Adjusted EBITDA | $ | (20,159) | | | $ | (15,457) | | | $ | (57,569) | | | $ | (36,959) | |
Free Cash Flow
We define “Free Cash Flow” as (i) net cash from operating activities less (ii) capital expenditures, net of proceeds from disposals of property and equipment, all of which are derived from our Condensed Consolidated Statements of Cash Flow. The presentation of non-GAAP Free Cash Flow is not intended as an alternative measure of cash flows from operations, as determined in accordance with GAAP. We believe that this financial measure is useful to investors because it provides investors to view our performance using the same tool that we use to gauge our progress in achieving our goals and it is an indication of cash flow that may be available to fund investments in future growth initiatives. Below is a reconciliation of net cash used in operating activities to the Free Cash Flow financial measures for the periods presented below (in thousands):
| | | | | | | | | | | |
| Fiscal Years-to-Date Ended |
| October 2, 2022 | | October 3, 2021 |
| Net cash used in operating activities | $ | (60,903) | | | $ | (34,514) | |
| Capital expenditures | (31,366) | | | (31,509) | |
| Free Cash Flow | $ | (92,269) | | | $ | (66,023) | |
Other Non-GAAP Financial Measures Reconciliation
(In Thousands, Except Share and per Share Amounts)
| | | | | | | | | | | | | | | | | | | | | | | | | | |
| | Quarters Ended | | Years-to-Date Ended |
| | October 2, 2022 | | October 3, 2021 | | October 2, 2022 | | October 3, 2021 |
| | | | | | | | |
| | | | | | | | |
| | | | | | | | |
| | | | | | | | |
| | | | | | | | |
| | | | | | | | |
| | | | | | | | |
| | | | | | | | |
| GAAP cost of revenue | | $ | 6,629 | | | $ | 104 | | | $ | 12,883 | | | $ | 1,847 | |
| Stock-based compensation expense | | (1,067) | | | — | | | (1,317) | | | (274) | |
| Non-GAAP cost of revenue | | $ | 5,562 | | | $ | 104 | | | $ | 11,566 | | | $ | 1,573 | |
| | | | | | | | |
| GAAP gross margin | | $ | (6,621) | | | $ | (104) | | | $ | (7,774) | | | $ | (1,847) | |
| Stock-based compensation expense | | (1,067) | | | — | | | (1,317) | | | (274) | |
| Non-GAAP gross margin | | $ | (5,554) | | | $ | (104) | | | $ | (6,457) | | | $ | (1,573) | |
| | | | | | | | |
| GAAP research and development (R&D) expense | | $ | 13,948 | | | $ | 10,301 | | | $ | 42,506 | | | $ | 25,413 | |
| Stock-based compensation expense | | (3,372) | | | (1,290) | | | (9,705) | | | (4,197) | |
| Non-GAAP R&D expense | | $ | 10,576 | | | $ | 9,011 | | | $ | 32,801 | | | $ | 21,216 | |
| | | | | | | | |
| GAAP selling, general and administrative (SG&A) expense | | $ | 13,110 | | | $ | 8,791 | | | $ | 36,545 | | | $ | 17,500 | |
| Stock-based compensation expense | | (4,260) | | | (1,752) | | | (11,095) | | | (2,246) | |
| Non-GAAP SG&A expense | | $ | 8,850 | | | $ | 7,039 | | | $ | 25,450 | | | $ | 15,254 | |
| | | | | | | | |
| GAAP operating expenses | | $ | 27,058 | | | $ | 19,092 | | | $ | 79,051 | | | $ | 42,913 | |
| Stock-based compensation expense included in R&D expense | | (3,372) | | | (1,290) | | | (9,705) | | | (4,197) | |
| Stock-based compensation expense included in SG&A expense | | (4,260) | | | (1,752) | | | (11,095) | | | (2,246) | |
| Non-GAAP operating expenses | | $ | 19,426 | | | $ | 16,050 | | | $ | 58,251 | | | $ | 36,470 | |
| | | | | | | | |
| GAAP loss from operations | | $ | (33,679) | | | $ | (19,196) | | | $ | (86,825) | | | $ | (44,760) | |
| Stock-based compensation expense | | (8,699) | | | (3,042) | | | (22,117) | | | (6,717) | |
| Non-GAAP loss from operations | | $ | (24,980) | | | $ | (16,154) | | | $ | (64,708) | | | $ | (38,043) | |
| | | | | | | | |
| GAAP net loss | | $ | (82,013) | | | $ | (10,838) | | | $ | (40,441) | | | $ | (41,306) | |
| Stock-based compensation expense | | 8,699 | | | 3,042 | | | 22,117 | | | 6,717 | |
| Change in fair value of convertible preferred stock warrants and common stock warrants | | 50,160 | | | (8,460) | | | (44,040) | | | (3,679) | |
| | | | | | | | |
| | | | | | | | |
| Loss on early debt extinguishment | | — | | | 60 | | | — | | | 60 | |
| Non-GAAP net loss | | $ | (23,154) | | | $ | (16,196) | | | $ | (62,364) | | | $ | (38,208) | |
| | | | | | | | | | | | | | | | | | | | | | | | | | |
| | Quarters Ended | | Years-to-Date Ended |
| | October 2, 2022 | | October 3, 2021 | | October 2, 2022 | | October 3, 2021 |
| | | | | | | | |
| GAAP net loss per share, basic | | $ | (0.53) | | | $ | (0.08) | | | $ | (0.27) | | | $ | (0.38) | |
| GAAP weighted average number of common shares outstanding, basic | | 153,332,007 | | | 133,492,216 | | | 152,497,010 | | | 109,317,614 | |
| | | | | | | | |
| GAAP net loss per share, diluted | | $ | (0.53) | | | $ | (0.14) | | | $ | (0.55) | | | $ | (0.45) | |
| GAAP weighted average number of common shares outstanding, diluted | | 153,332,007 | | | 135,052,128 | | | 153,773,271 | | | 109,854,540 | |
| | | | | | | | |
| Non-GAAP net loss per share, basic | | $ | (0.15) | | | $ | (0.12) | | | $ | (0.41) | | | $ | (0.35) | |
| GAAP weighted average number of common shares outstanding, basic | | 153,332,007 | | | 133,492,216 | | | 152,497,010 | | | 109,317,614 | |
| | | | | | | | |
| Non-GAAP net loss per share, diluted | | $ | (0.15) | | | $ | (0.12) | | | $ | (0.41) | | | $ | (0.35) | |
| GAAP weighted average number of common shares outstanding, diluted | | 153,332,007 | | | 135,052,128 | | | 153,773,271 | | | 109,854,540 | |
| | | | | | | | |
Management’s Use of Non-GAAP Financial Measures
EBITDA, Adjusted EBITDA, Free Cash Flow and other non-GAAP measures are intended as supplemental financial measures of our performance that are neither required by, nor presented in accordance with GAAP. We believe that the use of Non-GAAP measures provides an additional tool for investors to use in evaluating ongoing operating results, trends, and in comparing our financial measures with those of comparable companies, which may present similar Non-GAAP financial measures to investors.
However, you should be aware that when evaluating the non-GAAP measures, we may incur future expenses similar to those excluded when calculating these measures. In addition, the presentation of these measures should not be construed as an inference that our future results will be unaffected by unusual or nonrecurring items. Our computation of EBITDA, Adjusted EBITDA, Free Cash Flow and other Non-GAAP measures may not be comparable to other similarly titled measures computed by other companies, because all companies may not calculate the Non-GAAP measures in the same fashion.
Forward-Looking Statements
This letter to shareholders contains forward-looking statements within the meaning of Section 27A of the Securities Act of 1933, as amended, and Section 21E of the Securities Exchange Act of 1934, as amended, about us and our industry that involve substantial risks and uncertainties. Forward-looking statements generally relate to future events or our future financial or operating performance. In some cases, you can identify forward-looking statements because they contain words such as “will,” “goal,” “prioritize,” “plan,” “target,” “expect,” “focus,” “look forward,” “opportunity,” “believe,” “estimate,” “continue,” “anticipate,” and “pursue” or the negative of these terms or similar expressions. Forward-looking statements in this letter to shareholders include, but are not limited to, statements regarding our ability respond to customer demand and the strength of such demand, our financial and business performance, the timing of our orders of equipment for the Gen2 Autoline, the period of time that takes for our customers to qualify the Gen2 Autoline, our plans to bring additional Gen2 Autolines up over 2024, our plans to fully deliver Gen2 manufacturing equipment in the second half of 2023 followed by our Agility Line, our projected run rate for producing batteries in 2023, the production of our Gen2 Autoline once fully ramped, the product revenue we expect the original lines in Fab-1 to produce in 2023, the progress made toward scaling production by focusing Fab-1 on high-profile consumer product launches and ongoing learning for Gen2, our revenue funnel and our ability to advance customers from funnel opportunities to design wins and revenue, our focus on the portable electronics market, our estimates of the total addressable market for lithium-ion batteries in the wearables, computing, and mobile communications markets, our strategy and plans to engage in the EV battery market, including pursuing joint venture or licensing partnerships with automakers or battery OEMs, emergence of new applications for our batteries, our ability to meet milestones and deliver on our objectives and expectations, the implementation and success of our business model and growth strategy, including targeting various addressable markets and the expansion of our customer base, our forecasts of our financial and performance guidance and metrics, and our ability to produce industry leading margins. Actual results could differ materially from these forward-looking statements as a result of certain risks and uncertainties, including, without limitation, our ability to improve energy density among our products, our ability to establish sufficient manufacturing and optimize manufacturing processes to meet demand, sourcing or establishing supply relationships, adequate funds to acquire our next manufacturing facility, market acceptance of our products, changes in consumer preferences or demands, changes in industry standards, the impact of technological development and competition, and global economic conditions, including inflationary and supply chain pressures as well as effects of the COVID-19 pandemic, and political, social, and economic instability, including as a result of armed conflict, war or threat of war, terrorist activity or other security concerns or trade and other international disputes that could disrupt supply or delivery of, or demand for, our products. For additional information on these risks and
uncertainties and other potential factors that could affect our business and financial results or cause actual results to differ from the results predicted, please refer to our filings with the Securities and Exchange Commission (the “SEC”), including in the “Risk Factors” and “Management’s Discussion and Analysis of Financial Condition and Results of Operations” sections of our most recently filed annual report on Form 10-K and quarterly report on Form 10-Q and other documents that we have filed, or that we will file, with the SEC. Any forward-looking statements made by us in this letter to shareholders speak only as of the date on which they are made and subsequent events may cause these expectations to change. We disclaim any obligations to update or alter these forward-looking statements in the future, whether as a result of new information, future events or otherwise, except as required by law.